Curated OER
I'm Warm Now
Third graders graph how much water is wasted while waiting for it to get warm in the spigot in the sink. In this graphing lesson plan, student first predict how much water is wasted. That night they test it out at home and the next day...
Curated OER
Raising the Bar While Hogging the Ham (Radio, That Is)
Young scholars watch a Cyberchase video to determine the importance of using the correct scale when making bar graphs. They examine how to use bar graphs to gain information easily. They determine how to use bar graphs persuasively.
Texas Instruments
Math TODAY for TI-Navigator System - Is Leisure Time Really Shrinking?
High schoolers organize data from the USA TODAY Snapshot, "Is leisure time really shrinking?" into two scatter plots and determine the quadratic model for each scatter plot. They determine if these graphs intersect and learn the concept...
Curated OER
Bouncing Ball Experiment
Students collect data for a bouncing ball and select one bounce to analyze. They explore the relationship between velocity, position and acceleration. They seek out connections between the graphs and the physical motion of the ball.
Curated OER
Cool Liquids
Chemistry neophytes use a temperature probe to assess the change as five different liquids evaporate. The implantation section suggests that they take readings every five seconds for a total of four minutes. They graph the data, look up...
Curated OER
Farm Stories, Animal Webbing, Favorite Farm Animal Graph
Students brainstorm animals they would expect to see on a farm. They save these on a Kidspiration web. Students watch or read a farm story. They discuss the characters. Students vote for their favorite farm animal and crate a graph using...
Texas Instruments
Let's Play Ball with Families of Graphs
Learners explore quadratic equations in this Algebra II lesson. They investigate families of quadratic functions by graphing the parent function and family members on the same graph. Additionally, they write the equation of the parabola...
Curated OER
Atlatl Lessons Grade 4-12
Students experiment with velocity, ratios, and rates. In this data management lesson, students throw a dart with and without using an atlatl and collect and record various data. Students construct ratios based on the data and determine...
Curated OER
Tides - The Ins and Outs of Tides
Get your junior oceanographers to generate tidal prediction graphs on an interactive website. They will feel like experts in the field, or shall we say, experts in the ocean! This is a brief, but worthwhile activity that could be used to...
AIMS Education Foundation
Classroom Olympics
As the Summer Olympics are approaching, incorporate Olympic-type games into the classroom. From straw javelin to cotton ball shot put, these games are sure to keep leaners engaged. The best part is that there is math involved! Pupils...
Achieve
Greenhouse Management
Who knew running a greenhouse required so much math? Amaze future mathematicians and farmers with the amount of unit conversions, ratio and proportional reasoning, and geometric applications involved by having them complete the...
Curated OER
Analyzing Health
Third graders analyze their health. In this analysis lesson plan, 3rd graders rate their health on a 1-10 scale. They then tally the scores from the class and create a data chart. Then they answer true and false questions based on...
Curated OER
Be A Bug Scout
Students perform outside activities to determine the amount of insects, flowers, or common weeds within an area. They predict the number of insects they will find within their square area. Using calculators, students organize the data...
Howard Hughes Medical Institute
Tracking Genetically Modified Mosquitoes
What's that buzzing in your ear? An insightful lesson about genetically modified mosquitoes! Partnered pupils explore the creation, release, and monitoring of mosquitoes designed to reduce the mosquito population. After watching a video,...
Teach Engineering
Fun with Air-Powered Pneumatics
How high did the ball go? Engineering teams build a working pneumatic system that launches a ball into the air. The teams vary the amount of pressure and determine the accompanying height of the ball. An extension of building a device to...
Curated OER
Garbage Pizza
Fourth graders explore the concept of waste management. In this recycling lesson, 4th graders identify materials that must be landfilled as well as items that may be recycled or reused.
Curated OER
Box-and-Whisker Plots
Students explore nutritional information for several fast food hamburgers using statistical applications. In this statistics instructional activity, students analyze calories, fat, and sodium content of various fast food restaurants....
Curated OER
Exploring Quadratic Graphs
Students solve quadratic equations using graphs. For this algebra lesson, students factor quadratic equations and graph their answer. They discuss the shape of their graph based on the function.
Curated OER
The Tale of Scale
Eighth graders, using a range of data, produce three bar graphs for various scales along the y-axis.
Curated OER
Raising the Bar While Hogging the Ham (Radio That Is)
Young scholars create a bar graph that communicates an amount without the need to know the exact data, determine what scale to use to best represent the data and use their bar graph to persuade others.
Curated OER
Count The Letters
Students perform activities involving ratios, proportions and percents. Given a newspaper article, groups of students count the number of letters in a given area. They use calculators and data collected to construct a pie chart and bar...
Curated OER
Gravity, Angles, and Measurement
Students relate math to real life scenarios. In this geometry lesson, students launch a ball tracking each launch using a graph. They analyze their data for speed, angles and distance, trying to improve on each launch.
Curated OER
Straw Breathing Exercise
High schoolers fill out an anonymous questionaire to explore whether they might have asthma. They then set up a spreadsheet to enter the data, decide on a definition of asthma, and figure out the prevalence of asthma. Pupils simulate...
Curated OER
Is There a Problem with Wildlife on our Roads?
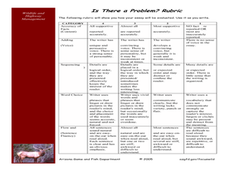
Students create a graph and analyze it to see if the data shows there is a problem with wildlife on the roads. In this wildlife collision lesson students write an essay to support their conclusions.


