Curated OER
How to Graph in Excel
Fourth graders construct data graphs on the Microsoft Excel program. In this statistics instructional activity, 4th graders formulate questions and collect data. Students represent their results by using Excel.
Curated OER
The Trash We Pass
Where does our garbage go? What is the difference between a recyclable and non-recyclable item? Pose these important, but often overlooked, questions to your class and invite them to consider the lasting and damaging effects of the...
Radford University
Budgeting Your Time and Money
Use mathematics to better manage money. Pupils learn about budgets and personal finance with a set of three lessons. They research salary data for their chosen careers, look up various costs of living to develop budgets, and plan an...
Curated OER
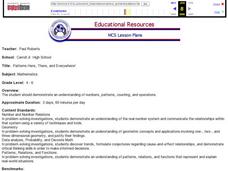
Patterns Here, There and Everywhere
Pattern recognition is a skill often used in mathematics. Learners count and sort manipulatives, organize the data into a graph and answer questions about the information displayed. They collect the objects to be used and create patterns...
Curated OER
When the Snow is as High as an Elephant
High schoolers study the concept of mean values using a data plot. Learners enter the given data in the activity to create their data table. They use the data table to calculate the mean of the snowfall percentage provided in the...
Visa
Allowances and Spending Plans
Help youngsters understand how to manage small amounts of money by discussing an allowance and the difference between spending, saving, and giving.
Curated OER
Novel Character Study
Students complete a character study using a database to compile information from a novel. They design a five slide presentation highlighting the character's reaction to different situations in the book. They write an acrostic poem using...
Newspaper Association of America
By the Numbers: Mathematical Connections in Newspapers for Middle-Grade Students
A cross-curricular resource teaches and reinforces mathematical concepts with several activities that use parts of a newspaper. Scholars use scavenger hunts to find the different ways math is used in the paper along with using data...
Curated OER
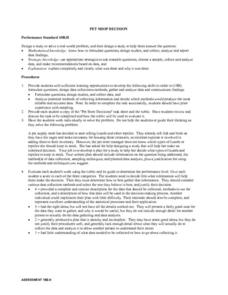
Pet Shop Decision
Students are given the "Pet Store Decisions" task sheet and a rubric that goes with it. Students discuss the task and make a plan for using the rubric sheet to complete the task. Students formulate questions, studies and data collection...
Curated OER
How do We Treat Our Environment?
Seventh graders explore the concept of collecting data. In this data collection instructional activity, 7th graders survey others about their environmental habits. Students graph their data.
Curated OER
McCadam's Quarterly Report
Fourth graders problem solve a problem from a local business using data, generating graphs, and draw conclusions. They submit their findings in a business letter format with feed back from a company's plant manager.
Curated OER
Tourism in London
Students discuss the tourist attractions that are in London. They examine how data can be manipulated by completing a worksheet. They plan a trip to a London attraction after conducting Internet research.
Curated OER
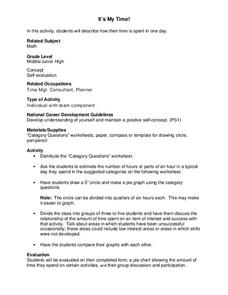
It's My Time!
Students create a pie chart. In this time lesson, students determine the amount of time they spend on given activities. They create a pie chart diagraming the data. Students share their graphs with the class.
Discovery Education
Mood Music!
Grouchy? Sad? Here's a great resource that shows kids how music can be used to lift their spirits. Kids collect and chart data on the effects of music on emotions. After analyzing the results of their experiment, they develop their own...
Curated OER
Sampling Distribution of Sample Means
Students collect data and crate a distribution sample. In this statistics lesson, students compare and contrast their collected data. This assignment requires the students to be comfortable with navigating the internet.
Curated OER
More Jelly Bean Math
Students use their color categorized jelly beans to find the range, mean, median and mode. They use their recorded data documenting how many jelly beans there are for each color in order to calculate the range, mean, median and mode of...
Curated OER
Spaghetti Bridges
Eighth graders experiment with building bridges of spaghetti, pennies, and a cup to determine how varying the number of spagetti pieces affects the strength of the bridge. They graph their results and interpret the data.
Curated OER
Snack Attack
Students design charts, tables, graphs, and pictographs to analyse the types of snacks in a bag.
Curated OER
Let's Build a Worm Bin
Students explore the process of decomposition. In this ecology and measurement lesson, students prepare a worm home to be used for vermicomposting. Students weigh a group of worms and the added food, recording this information on a data...
Curated OER
Applied Science - Built Environment Lab
Young scholars evaluate trash. For this Science lesson, students collect and weigh trash from their classrooms. Young scholars categorize the trash and the corresponding weights, recording the information on a data sheet.
Curated OER
Count The Letters
Students perform activities involving ratios, proportions and percents. Given a newspaper article, groups of students count the number of letters in a given area. They use calculators and data collected to construct a pie chart and bar...
Curated OER
Rules of the Roll
Students roll a ball down a plank and measure the distance it travels. Students graph the distances the ball travels as they change the height of the incline (increase slope).
Curated OER
Multiply Whole Numbers and Decimals
In this decimals activity, students analyze the data on a table and then read and solve 6 problems. Students read the story problems and multiply a decimal number by a whole number to solve.
Curated OER
Separating Soup Mix
Students use screens of three sizes to separate a mixture of five solid materials. They plan and conduct simple investigations using appropriate tools, measures, and safety rules and record and report observations, explanations, and...


