Curated OER
Spaghetti Bridges: Student Worksheet
In this math worksheet, students will create a "bridge" out of spaghetti and test it's strength with pennies. Students will record their results on a table and then graph the results.
Curated OER
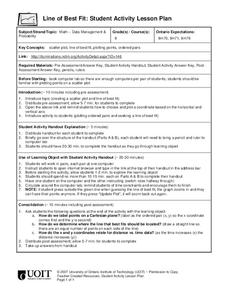
Line of Best Fit
Students calculate the equation of the line of best fit. For this statistics lesson, students create scatter plots and find the line of best fit going through their data. They make predictions and draw conclusions.
Curated OER
Altering a Plant Environment
Students investigate what a controlled group is by creating an experiment. In this plant growth lesson, students identify the different parts of a plant and discuss what is needed for a plant to be successfully grown. Students grow a...
Curated OER
Be A Bug Scout
Students perform outside activities to determine the amount of insects, flowers, or common weeds within an area. They predict the number of insects they will find within their square area. Using calculators, students organize the data...
Curated OER
Global Warming Statistics
Learners research and collect data regarding temperature changes for a specific location and find the mean, median, and mode for their data. In this climate change lesson plan, students choose a location to research and collect data...
Curated OER
Two-Variable Linear Inequalities
Here is an engaging instructional activity on solving equations with two variables. Have the class rewrite linear equations in the slope intercept form, y=mx + b. They graph the lines using the slope and y-intercepts.
Curated OER
Boxplots Introduction
Students describe the pattern of a bell curve graph. In this statistics lesson, students move data around and make observation about the mean, and the quartiles. They define boxplot, outlier, range and other important vocabulary words...
Curated OER
Graphing
Learners collect data to create different types of graphs-line, pie, and bar graphs. They use StarOffice 6.0 to create graphs.
Curated OER
Money Management
Young scholars choose an occupation and set up a paper family and household. They create a monthly budget, pay monthly bills and file taxes. They practice math skills using financial information and view money as a resource. They create...
Curated OER
Shake, Rattle and Roll
Sixth graders explore the causes and effects of earthquakes. They also collect and analyze data in graphs. They also use the Internet to research earthquakes
Curated OER
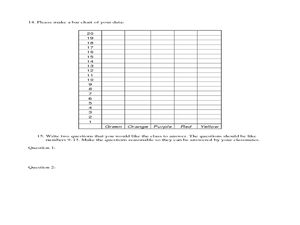
Using Ratios to Taste the Rainbow
Students solve problems using ratios and proportion. In this algebra lesson, students analyze skittles and their different colors as they apply the properties of ratios and proportions to solve their problems.
Teach Engineering
Fun with Air-Powered Pneumatics
How high did the ball go? Engineering teams build a working pneumatic system that launches a ball into the air. The teams vary the amount of pressure and determine the accompanying height of the ball. An extension of building a device to...
Curated OER
Analyzing Health
Third graders analyze their health. In this analysis lesson plan, 3rd graders rate their health on a 1-10 scale. They then tally the scores from the class and create a data chart. Then they answer true and false questions based on...
Curated OER
Graphing Real World Situations
High schoolers solve linear equations using graphs. In this algebra lesson, students depict real life situation using lines and functions. They identify the slope, data and predict graphing behavior.
Curated OER
How Many More on a Graph?
First graders identify a number that is one more or one less than a number up to one hundred and identify a mystery number. They also create a class graph that illustrates how many children are in each family, and answer questions about...
Curated OER
Multiply Boxplots
Students identify the mean, quartiles and range of a boxplot. In this statistics lesson, students identify cooperative boxplot as it relates to the data. They make conjectures about students grade distribution.
Curated OER
Percentiles
Students analyze the bell curve and make predictions. In this statistics lesson, students calculate the percentile to the left of the curve. They then are given the percentile and create the graph from the data.
Curated OER
Find Minimum and Maximum
Learners engage in a lesson about finding the values of different graphs written in the vertex form. They rewrite each quadratic equation in vertex form while graphing the equation with the visual display of a parabola that matches the...
Texas Instruments
Golden Ratio Lab
Learners investigate the Golden Ratio in this algebra I or geometry lesson. They explore the Golden Ratio as the conduct an experiment in which they collect various measurement from their team members and find the regression equations...
Curated OER
Learning to Spend, Learning to Give
Middle schoolers create a monthly budget. In this finances lesson, students learn the terms budget, income and expenses. Middle schoolers create a monthly spending plan and keep track of what they make and spend for the next 30 days. ...
Curated OER
Help! I Need Five Minutes
Students practice ways to better manage their time. They keep track of their current use of time. Students prioritize and schedule events and use a daily planning calendar to schedule their time.
Curated OER
Garbage Pizza
Fourth graders explore the concept of waste management. In this recycling lesson, 4th graders identify materials that must be landfilled as well as items that may be recycled or reused.
Curated OER
Geo Jammin' By DeSign - Day 3, Lesson 15: The Quiltmaker's Gift
Students listen to a read aloud of The Quiltmaker's Gift by Jeff Brumbeau finding examples of symmetry in the illustrations in the book.
PwC Financial Literacy
Insurance Why's and How's
Middle schoolers explore the primary purposes of a variety of types of insurance. They determine who benefits the most from insurance coverage, and examine the factors that lead to increases and decreases in insurance premiums. The...


