Curated OER
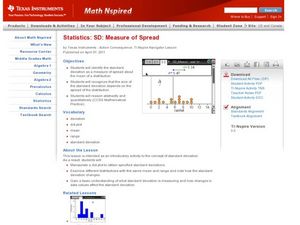
Measure of Spread
Students identify the standard deviation. In this statistics lesson, students find the mean distribution and calculate the percent of deviation from the mean. They observe this change on the Ti calculator.
Curated OER
Working Backwards
Learners explore the concept that to solve some problems, they may need to undo the key actions in the problem. This strategy is called working backwards asking the appropriate questions.
Curated OER
Use Information in Line, Bar, Circle, and Picture Graphs to Make Comparisons and Predictions
Eighth graders explore the concept of graphs. In this graphs lesson, 8th graders compare and contrast picture graphs, bar graphs, line graphs, and circle graphs. Students examine each type of graph and answer questions and make...
Curated OER
Exploring Quadratic Graphs
Students solve quadratic equations using graphs. For this algebra lesson, students factor quadratic equations and graph their answer. They discuss the shape of their graph based on the function.
Curated OER
Television: Comedy Vs. Drama
Students investigate the world of Television by contrasting specific programs. In this visual storytelling lesson, students compare and contrast the differences between comedy and drama by making a Venn Diagram. Students utilize the...
Curated OER
Do You Like to Spend or Save?
Students, after briefly discussing spending and saving habits, take a poll to see how their peers like to manage money. Then students graph their findings and discuss the survey results.
Curated OER
Geo Jammin' By DeSign - Day 5, Lesson 28: The Mo-tea-if
Second graders explore tea dyeing cloth.
Curated OER
Geo Jammin' By DeSign - Day 6, Lesson 32: Appliqué-tion of Learning
Second graders hand stitch three different appliqué stitches using triangles as a motif.
Curated OER
Geo Jammin' By DeSign - Day 1, Lesson 6: Quilt Story
Learners recognize that quilts are created by geometric components. They examine how quilts are an artistic art form that show the cultural heritage of the people who make them.
Curated OER
Geo Jammin' By DeSign - Day 3, Lesson 12: Jammin
Students review definitions of word wall words using songs, movement and sharing.
Curated OER
Geo Jammin' By DeSign - Day 7, Lesson 36: DeSign Sampler
Second graders, in groups, write quilt reports.
Curated OER
Geo Jammin' By DeSign - Day 7, Lesson 37: Summarizing for the Summative
Students listen for specific information during summary presentations. They practice giving feedback on given topic according to a set of standards. The speaker reports to the rest of class from a report and listeners determine if...
Teach Engineering
Flow Rates of Faucets and Rivers
Go with the flow and use a helpful resource. A set of two activities has learners investigate flow rates. They first determine the flow rate of a faucet by measuring how long it takes to fill a bucket. Using the results, they make a...
Missouri Department of Elementary
Are You Balanced?
Balance scales create a strong visual of how an individual prioritizes one's self alongside their commitments to the community, school, and home. Scholars complete a graphic organizer then discuss their findings with their peers. A...
Curated OER
El Salvador: Whose Breakfast Isn't for the Birds?
Sixth graders investigate the understanding of where coffee is grown by conducting a survey. They study the natural history of coffee and examine bird habitats in the areas where coffee is grown. They write letters to explaining the...
Curated OER
Math: How Many Ways Can You Find the Middle?
Twelfth graders find the mean, median, and modes of stacks of Lego blocks, They search in newspapers for real life applications of them. They present oral reports on what they have learned.
Curated OER
Reservoir Activity
Students research the economic importance of the major reservoirs in Illinois. In groups, they manage a budget for one of the lakes to promote tourism in the area. They also work together to create advertisements.
Curated OER
The Great Chile Challenge
Fifth graders gather data, create a graph, and interpret information. They build vocabulary by negotiating the ideas that go into the graphs which they create. They use Excel to print a variety of graphs based on how much they like Chile...
Curated OER
Ladybugs in the Garden
Fifth graders estimate the size a population (ecosystems) Students make a chart from information collected then create a graph (line or bar) from this information. Students do a lesson where they observed, examine, and record data...
Curated OER
Raising the Bar While Hogging the Ham (Radio, That Is)
Young scholars watch a Cyberchase video to determine the importance of using the correct scale when making bar graphs. They examine how to use bar graphs to gain information easily. They determine how to use bar graphs persuasively.
Curated OER
My Community
First graders design a Powerpoint presentation to reflect information about their community. In this community lesson, 1st graders create slides to explain the weather, geography and other information about the city.
Curated OER
Riding on a Pendulum
A comprehensive resource gets fourth grade physical scientists making observations about the period of a pendulum and then applying knowledge to a playground swing. Through seven different stations, they will record observations and...
Curated OER
Spaghetti Bridges
Students thread a piece of spaghetti through the holes in the cup. One person suspend the cup by placing each index finger approximately one inch in from the ends of the spaghetti.
Curated OER
Attributes of Renewable Energy: From Nanopossibilities to Solar Power
High schoolers explore solar energy, why we use it and how we use it. In this renewable energy lesson students compare active and solar techniques.


