Curated OER
Chart This!
Learners collect and analyze data. In this middle school mathematics lesson, students collect data on three to four traits or favorites. Learners analyze their data and create a chart of graph for each trait or favorite they researched.
Curated OER
Grasping Graphs
In this grasping graphs worksheet, students solve and complete 3 different types of problems. First, they graph the data described and select the appropriate graph type. Then, students identify the independent and dependent variable. In...
Curated OER
Stemmin'-n-Leafin'
Learners make stem and leaf charts to determine the measures of central tendency using test score data. They analyze the data to draw inferences which they share with the class. They complete the associated worksheets.
Curated OER
Pie Charts
In this math activity, students complete the work in order to chart the data into the pie graph. The picture is used for statistical analysis.
Curated OER
My Favorite Birthday
Learners collect and organize data from classmates, display data on simple chart, and plan class birthday party.
Curated OER
Graphing With Candy
Students gather information and interpret the results using a tally chart, a table, and a bar graph.
Curated OER
Math Centers
Fifth graders review the concepts of fractions: improper, mixed, proper, like denominator addition. They then review the concepts of creating pie graphs using a percent circle using manipulatives.
Curated OER
Graphing on the Computer
Learners create a bar graph on the computer using given information from the teacher. They create a bar graph using their own information chart (they need to create one on separate paper first). They utilize Microsoft Excel for this lesson.
Curated OER
Circle Graphs
Sixth graders interpret, create, and display data in a circle graph. In this circle graph lesson plan, 6th graders use a compass, protractors, pizza boxes, and more to create a circle graph and analyze the data they put into it.
Curated OER
Candy Bar Survey
Second graders investigate the skill of graphing data by using candy bars to create context for the lesson. They use technology for graphing and organizing information like a spreadsheet. The lesson includes a resource link to aid in the...
Curated OER
What's Your Favorite Season?
Pupils collect data on the favorite seasons. In this data collection and analysis lesson, students learn about displaying data on charts and graphs. They collect data about the favorite seasons of the children in their class and display...
Curated OER
Line Graphs and Commercial Costs
Students investigate line graphs. For this middle school mathematics lesson, students compare and contrast different types of graphs and create line graphs based on the data provided.
Curated OER
Reading and Making Pie Graphs
In this pie graphs worksheet, students solve 10 different problems that include reading a pie graph. First, they use the pie graph to respond to 5 questions that follow. Students determine the year that had the smallest and largest...
Curated OER
Which Graph is best?
Students use commercial software to organize and visually display data to draw conclusions; students use graphing software to create several types of graphs illustrating the number of each color of M&M's in one bag.
Curated OER
No New Workers Need Apply
Students explore older people's perspectives on work and retirement by creating charts to reflect statistical trends and formulate interview questions. They write follow-up articles that record and comment on the attitudes of their...
Curated OER
Exploration of "Pillbugs"
Fifth graders define vocabulary terms, identify the characteristics of a pillbug, and create a dichotomous key. Then they examine the pillbugs and make observations and record these observations. Finally, 5th graders observe specific...
Curated OER
Asthma Survey
Learners collect survey data on the prevalence of asthma in a community. They summarize and display the survey data in ways that show meaning.
Curated OER
Coin Count & Classification
Students make a prediction about how 100 pennies sort by decade or year and then test their predictions. They organize their data using a graph that is imbedded in this lesson.
Curated OER
Education for Global Peace
Fifth graders construct data graphs based upon sets of data. In this graphing instructional activity, 5th graders read the text If the World Were a Village and discuss how types of graphs accurately represent a large population. Students...
Curated OER
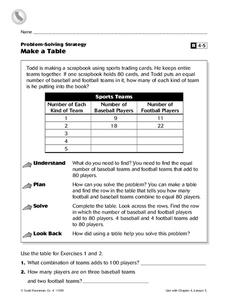
Make a Table
In this charting activity, 4th graders complete a table. Using the information provided, students fill in the missing data and complete 2 short answer questions.
Curated OER
My Test Book: Reading Graphs
For this online interactive math skills worksheet, students solve 10 multiple choice math problems that require them to read and interpret graphs. Students may view the correct answers.
Curated OER
Line Graphs 4
In this graph worksheet, students interpret given line graphs. They determine the range, and identify the range in a set of data. This one-page worksheet contains approximately 14 problems.
Curated OER
Graphs Abound
Young scholars create a survey for their classmates to collect data on their favorite foods, eye color, pets or other categorical data. They compile the data from the survey in a table and then make a bar graph of each category using a...
Curated OER
Balloon Graphing
Fourth graders explore data, charts and graphs. They create graphs using titles, labels, axes, intervals, and scale correctly. Students enter their data into Excel and create a graph.


