Curated OER
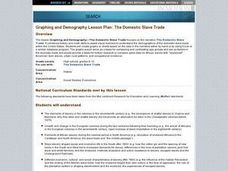
Graphing and Demography: The Domestic Slave Trade
Students create graphs or charts based on the data a narrative imbedded in this plan. They make them either by hand or by using Excel or a similar database program. This lesson utilizes technology in a meaningful way.
Curated OER
Algebra: Do You See What I See?
Students discover how to find the mean, median, and mode from sets of data. By using statistical techniques such as whisker plots and bar graphs, they display the data gleaned from problems. Individually, students complete projects...
Curated OER
Scientific Observation of Force and Acceleration on an Object
In this force and acceleration worksheet, 8th graders answer ten questions based on two graphs. The first graph is a scatter plot, the second is a line graph.
Curated OER
Which Car Should I Buy?
Students use gas mileage of different cars to create T charts, algebraic equations, and graphs to show which gets better mileage. In this gas mileage lesson plan, students use the graph to see which car they should buy.
Alabama Learning Exchange
The Grouchy Ladybug
Students listen to the book, "The Grouchy Ladybug" by Eric Carle and sequence the events in the story. Using a graph, they draw and color the animals that the ladybug meets next to the corresponding time from the story, and conduct...
Curated OER
Jelly Bean's Galore
Young scholars investigate the origins of the Jelly Bean. They complete a Scavenger Hunt using the jellybean website. Pupils create a bar graph using information collected about jelly beans. Students discuss the time of year that Jelly...
Curated OER
Pumped Up Gas Prices
Learners calculate gas prices. In this transportation lesson, students tally the mileage and gas costs of their car for one months. They figure out how much was spent on gas and create a graph showing average gas prices over time.
Curated OER
T-Shirt Lettering
Learners determine the cost of a t-shirt using a variety of mathematical operations to solve problems. Then they use a spreadsheet to calculate the cost of lettering a t-shirt and display this information in a graph.
Curated OER
Shake, Rattle and Roll
Sixth graders explore the causes and effects of earthquakes. They also collect and analyze data in graphs. They also use the Internet to research earthquakes
Curated OER
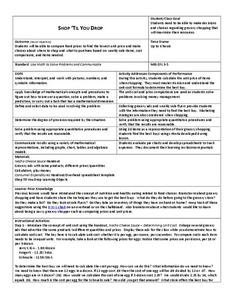
Shop 'Til You Drop
Students evaluate food prices. In this real world math lesson plan, students compare the cost of various grocery items to determine which is the best deal. They work in groups using grocery ads to decide how to get the most product for...
Curated OER
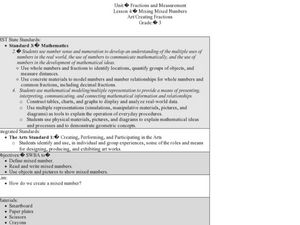
Mixing Mixed Numbers Art/Creating Fractions
Third graders explore number values by participating in class math activities. In this fractions lesson, 3rd graders collaborate with classmates to discuss the technique of adding mix numbers while utilizing paper plates to help...
Curated OER
Virtual Field Trip / Route, Mileage and Gasoline Cost Graphs
Students use a spreadsheet program to graph and compare milage, gasoline costs and travel time for two travel routes in their virtual field trip in Michigan. They determine the most economical route based on the graphs and calculations.
Curated OER
Let's Graph It!
Students graph the height of others in centimeters and inches, find the slope of line in order to calculate the conversion factor between centimeters and inches.
Curated OER
Graph Your Foot!
Students measure their own foot and place the outline on a graph. They make connections between the size of their foot and the bar graph that represents it.
Curated OER
Delicious Graphing
Fourth graders sort trail mix by type and use that information to create different types of graphs for comparing.
Curated OER
Fun With Graphs
First graders read about making graphs and lean how to make graphs using "The Graph Club" software.
Curated OER
Math: Party Time!
Twelfth graders discover how to calculate the total costs for a party. They determine the unit prices of food and supplies, the quantities needed, and complete a chart displaying their findings. Students calculate the costs per serving...
Curated OER
Plotting Wind Speed and Altitude
Students construct, read and interpret tables, charts and graphs. They draw inferences and develop convincing arguments that are based on data analysis. They create a graph displaying altitude versus wind speed.
Curated OER
Volume, Mass, and Weight
Study the difference between mass and weight. Your math group will compare the weight of an item to the amount of space that it uses. They'll then use conversion factors to find the difference between kilograms and pounds. Essential...
Curated OER
How Does Your Blue Bonnet Grow?
Young scholars explore the conditions needed to grow Texas Blue Bonnets. In this Blue Bonnet planting lesson, students recognize the differences in Texas Blue Bonnet. Young scholars record their findings in a graphs and analyze their...
Curated OER
It's Your Choice
Students compare data and determine the appropriate way to organize the data. They use physical graphs, pictographs, and symbolic graphs to display their data. In addition, they complete a Venn diagram.
Curated OER
Take Me Out To the Ball Game
Students use a map to graph and locate major league teams of different sports. In groups, they analyze the population data of the United States and compare it with the amount and location of the major league teams. They share their...
Curated OER
A Real Difference
Fifth graders use the Celsius and Fahrenheit thermometers to compare temperature readings. They use the Internet to find the temperatures of selected cities. After data is collected for five days, 5th graders graph the temperatures.
Curated OER
Virtual Field Trip
Learners calculate gasoline cost per mile on a virtual field trip. They calculate the gasoline costs and travel time for each of the 2 routes, and record on a data sheet. They use Excel to create data tables for mileage, gasoline...


