Curated OER
Fun With Graphs
First graders read about making graphs and lean how to make graphs using "The Graph Club" software.
Curated OER
Math Investigations 2
Young mathematicians practice measuring and graphing skills while working in groups to measure objects found in the classroom. Using their measurements, they create one bar graph displaying the lengths and another displaying the widths.
Physics Classroom
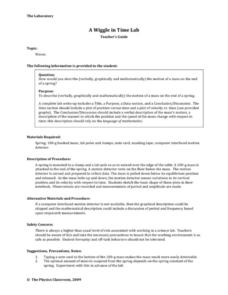
A Wiggle in Time Lab
Though an alternative method is suggested, the best way to carry out this investigation is with the use of a computer-interfaced motion detector. Physics fanatics hang a mass on the end of a spring and analyze its motion verbally,...
Curated OER
Plotting Wind Speed and Altitude
Students construct, read and interpret tables, charts and graphs. They draw inferences and develop convincing arguments that are based on data analysis. They create a graph displaying altitude versus wind speed.
University of North Carolina
Figures and Charts
Sometimes words aren't the best way to get information across to the reader. The eighth handout in the 24-part Writing the Paper series describes different type of figures and charts to display complex information in a paper....
Curated OER
Word Problems: "Leaving D.C."
In this solving math story problems worksheet, students read statistics from the Student edition of USA Today to solve word problems. Students solve 6 problems.
Curated OER
What's Cooking at the Good Times Cafe?
Students collect data from classmates showing their favorite lunch food. They enter their data and graph the results using a computer program.
Curated OER
Are you an Energy Saver STAR?
Young scholars examine how to use energy more efficiently in their own home. They collect data from their home, complete a chart, read a power meter, interpret the data from an electric and gas bill, and create a poster demonstrating how...
Curated OER
Different Perspectives of Oregon's Forest Economic Geography
Students map data on employment in wood products manufacturing in Oregon counties. In this Oregon forest lesson, students discover the percentage of people employed in the forest manufacturing industry. Students create a box and whisker...
Curated OER
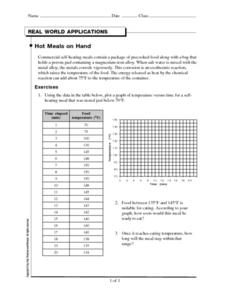
Hot Meals on Hand
In this exothermic reactions worksheet, students read about how commercial hot meals are heated through the use of exothermic reactions. They graph data of temperature and time elapsed for hot meals and answer two questions about the graph.
Texas State Energy Conservation Office
Investigation: Greenhouse Effect
Pupils compare the temperature change in a closed and open box as a demonstration of the greenhouse effect.
Curated OER
Lessen the Loan
Middle-schoolers explore the concept linear equations. They use the internet to navigate through videos and problems. Pupils problem solve to determine rates of change, slope, and x and y-intercepts.
Curated OER
Does The Type of Mulch Used Affect Plant Growth?
Students measure, record and graph the plants they grow in a controlled setting. They feed and water the plants as needed and use the scientific method to evaluate the growth.
Curated OER
View Tubes: Student Worksheet
Here is a worksheet that is almost a lesson! In it, learners conduct an experiment in which they determine the size of objects when viewed through viewing tubes. This resource has all of the instructions and tables necessary to complete...
Curated OER
Tiling a Patio
Fifth graders practice, with spreadsheets, to demonstrate how to determine the number of tiles needed to create a patio. They use pictures and gathered data to determine a pattern that can be used to solve problems. Students create a...
Curated OER
Harry Potter Research Project
Young scholars work together to complete a research project on Harry Potter. They write a research question and develop a survey to give to their classmates. Using the results, they create a graph and draw conclusions about the data...
Curated OER
Mr. Cobbler's Shoe Dilemma
Students employ statistics to solve real-world problems. They collect, organize and describe data. They make inferences based on data analysis. They construct, read, and interpret tables, charts and graphs.
Curated OER
Cold Enough?
Students read and record temperatures and display the data. They represent the temperatures on an appropriate graph and explain completely what was done and why it was done. Students display the data showing differences in the daily...
Curated OER
Statistics Newscast in Math Class
Students study sports teams, gather data about the teams, and create a newscast about their data. In this sports analysis instructional activity, students research two teams and define their statistical data. Students compare the two...
Curated OER
Box-and-Whisker
Seventh graders are introduced to the concept of box-and-whisker plots. A step-by-step process for creating a box-and-whisker plot is provided. The goal of the lesson is that students study the components of a box-and-whisker plot and be...
Curated OER
Childhood Obesity
Students identify a question to generate appropriate data and predict results. They distinguish between a total population and a sample and use a variety of methods to collect and record data. Students create classifications and ranges...
Curated OER
Comparison of Snow Cover on Different Continents
Students use the Live Access Server (LAS) to form maps and a numerical text file of snow cover for each continent on a particular date. They analyze the data for each map and corresponding text file to determine an estimate of snow cover...
Curated OER
Trouble in the Troposphere
Students Use data sets from MY NASA DATA to produce graphs comparing monthly and yearly ozone averages of several U.S. cities. They analyze and evaluate the data and predict trends based on the data. In addition, they discuss and...
Curated OER
The Origins and Maintenance of Earth's Atmosphere
For this atmosphere worksheet, students read over a data table showing the percentage of carbon dioxide, oxygen and nitrogen in the atmosphere over the last 4500 million years. Students create a graph comparing these gases over time and...


