Curated OER
Saving An Endangered Species
Second graders work in groups in order to look at specific internet sites for animal adoption and sponsorship. They select an endangered species, determine needed funds, develop, advertise, and carry out a fund-raising plan.
Curated OER
The Effects of Color on Heat Absorption And Climate
Young scholars conduct an experiment to determine the effects of soil color on its day and night time temperatures. In small groups, they prepare dishes of black soil, brown peat moss, and white sand. They record the temperature changes...
Texas Education Agency
Texas Gateway: Evaluating Data in Tables, Graphs and Charts
[Accessible by TX Educators. Free Registration/Login Required] In this lesson students look at examples of graphics, tables, charts, and graphs, and learn how to interpret their data. They will be able to use this skill to enhance their...
E-learning for Kids
E Learning for Kids: Math: Tea Store: Reading a Table
Students will demonstrate how to interpret information in a table.
University of Texas
Inside Mathematics: Parking Cars [Pdf]
This task challenges a student to use their understanding of scale to read and interpret data in a bar graph.
Cuemath
Cuemath: Line Graphs
A comprehensive guide for learning all about line graphs with definitions, their sections, how to read and create graphs, solved examples, and practice questions.
Shodor Education Foundation
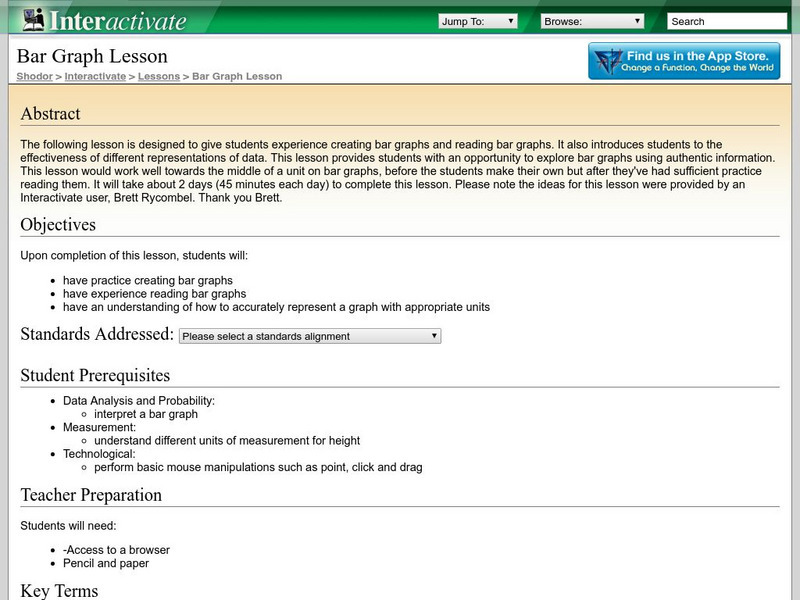
Shodor Interactivate: Lesson: Bar Graph
This lesson is designed to give students practice creating and reading bar graphs as well as understanding how to accurately represent a graph with appropriate units.
Texas Education Agency
Texas Gateway: Informational Text: Synthesize Information in Charts and Graphs
In this lesson, you will learn how to understand the data found in charts and graphs, and at the end of the lesson, you will practice what you have learned.
Khan Academy
Khan Academy: Picture Graphs (Pictographs) Review
Picture graphs are a fun way to display data. This article reviews how to create and read picture graphs (also called pictographs).
Khan Academy
Khan Academy: Reading Dot Plots & Frequency Tables
Practice reading basic dot plots and frequency tables. Students receive immediate feedback and have the opportunity to try questions repeatedly, watch a video or receive hints.
Better Lesson
Better Lesson: Going for the Gold
Second graders read and create graphs based on Olympic data for 2014.
Rice University
Rice University: Cynthia Lanius: Fun and Sun Rent a Car
A wide range of math skills is incorporated into a lesson that involves planning a family's vacation to Florida. Travel expenses are gathered and compared, graphed, and analyzed in hopes of finding the best prices. There are extension...
E-learning for Kids
E Learning for Kids: Math: Orange Trees, Olive Trees: Graphs
Tomas and Luna are farmers. See how many oranges and olives they have collected!
Texas Instruments
Texas Instruments: Math Today Challenge New Color of Money
In this activity, students will read about the changes in the "new money" and then create a graph to represent various combinations of currency produced. This activity provides an excellent example of discrete, real-world data.
Illustrative Mathematics
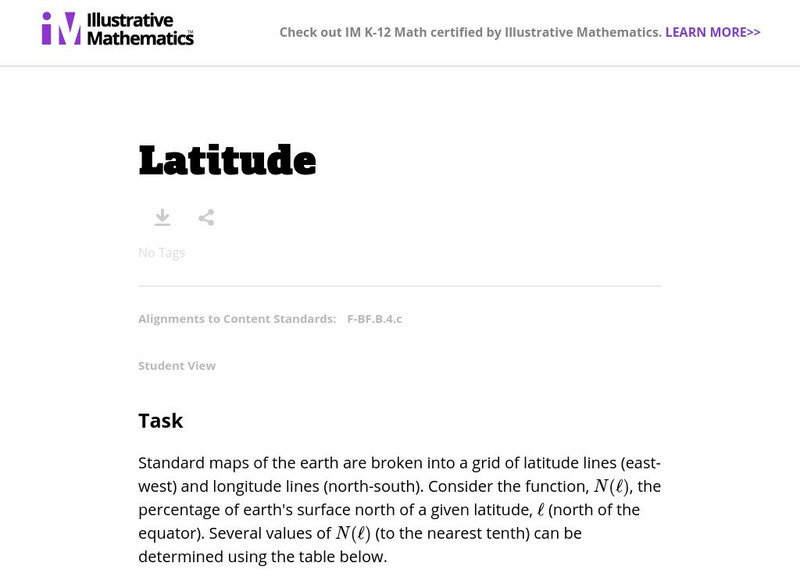
Illustrative Mathematics: F Bf Latitude
For this task, students are presented with data about latitude and the percentage of the Earth's surface north of each latitude line. They are to use this data to sketch a graph, analyze it, and build an understanding of an invertible...


![Inside Mathematics: Parking Cars [Pdf] Lesson Plan Inside Mathematics: Parking Cars [Pdf] Lesson Plan](https://d15y2dacu3jp90.cloudfront.net/images/attachment_defaults/resource/large/FPO-knovation.png)


