Virginia Department of Education
Normal Distributions
Pupils work to find probabilities by using areas under the normal curve. Groups work to calculate z-scores and solve real-world problems using the empirical rule or tables.
SRI International
The Water Crisis
Water, water, everywhere, right? Wrong. Learners assess their own knowledge of water availability on Earth. Then, through a reading, a teacher-led presentation, and an activity, pupils learn about the importance of available clean...
CK-12 Foundation
CK-12 Middle School Math Concepts - Grade 6
Twelve chapters cover a multitude of math concepts found in the Common Core standards for sixth grade. Each title provides a brief explanation of what you will find inside the chapter—concepts from which you can click on and learn more...
Curated OER
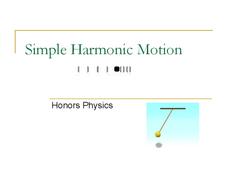
Simple Harmonic Motion
Back and forth, and back again. A presentation on harmonic motion would make a great backdrop for a directed instruction lesson in Honors Physics. It includes diagrams, formulas, graphs, and a few sample problems.
Curated OER
Santa's Route
In this route worksheet, learners observe a chart of Santa's route and answer word problems about the distance he travels between cities. They complete six problems.
Curated OER
Awesome Animals
Students collect data from classmates about their favorite animal. They use the ClarisWorks graphing program to enter data, graph results, and interpret data.
Curated OER
Education for Global Peace
Fifth graders construct data graphs based upon sets of data. In this graphing instructional activity, 5th graders read the text If the World Were a Village and discuss how types of graphs accurately represent a large population. Students...
Curated OER
Locating the Salt Front - Section 1
For this salt front of the Hudson River worksheet, 7th graders first read an excerpt about the lower portion of the Hudson River that is an estuary. Then they use a colored pencil to plot salinity data from the table shown on a graph,...
Curated OER
How Long? How Wide?
Second graders distinguish between and use nonstandard and standard units of measurement, use appropriate tools and techniques to measure length and width, and record and interpret data using graphs.
Curated OER
Virtual Field Trip
Are we there yet? Young trip planners learn about their state and plan a trip. They will select sites to see in three cities in their state, and record associated costs in a spreadsheet. While this was originally designed as a...
Curated OER
Snow Cover By Latitude
Students examine computerized data maps in order to create graphs of the amount of snowfall found at certain latitudes by date. Then they compare the graphs and the data they represent. Students present an analysis of the graphs.
Curated OER
What's Your Favorite Planet?
Fourth graders interpret a graph and make correlations using data. After taking a class survey, 4th graders create a class graph of their favorite planets. Working in small groups, they interpret the information and create at least ten...
Curated OER
Confusing Colors!
Fourth graders collect data, graph their data, and then make predictions based upon their findings. They's interest is maintained by the interesting way the data is collected. The data collection experiment is from the psychology work of...
Curated OER
Displaying The Data
Students engage in a research project to find information about one's personal family heritage. They collect information by conducting family interviews. Students use the data to create a graph, map, and timeline. Then students take part...
Miami University
Chapter Nine Worksheet: Monopoly
Advanced economics pupils analyze a series of graphs, data sets, and profit scenarios all related to monopolies and marginal revenue. They read through the background information, complete a graph using the data provided, and justify...
Curated OER
A Research Project and Article For the Natural Inquirer
Get your class to use the scientific process to solve a scientific problem. They utilize the Natural Inquirer magazine to identify a research question which they write an introduction to and collect data to answer. They use graphs,...
Curated OER
Math Hunt
Go on a scavenger hunt around your school to find evidence of math. Investigate different areas of your school for patterns, fractions, and different geometric shapes. Finally, create a spreadsheet and plot the data you've collected.
Curated OER
Discovering Pi
Define terminology related to a circle. Practice accuracy in measuring and then create a spreadsheet based on data collected from solving for parts of a circle. Groups can have fun analyzing their data as it relates to Pi.
Shmoop
ELA.CCSS.ELA-Literacy.SL.9-10.2
What are diverse media formats? Have your class figure this out on their own through small-group brainstorming. The resource includes two related activities about different kinds of data that will help your class get a grasp of media...
Curated OER
Oh, What A Day
Students listen as the teacher reads A Country Far Away. They predict what they will do and what they think their partner student will be doing. Students create a KWL chart for Japan. They collect information about their activities on an...
Yummy Math
Deflate-gate
Does temperature affect the air pressure of a football? Young mathematicians look at the readings from a pressure gauge and determine if the balls are within regulation or are under inflated.
Curated OER
Science and Technology
Students research inventions that have been created. In this historical technology lesson, students read the Harcourt Brace social studies textbook and discuss how inventors used graphs to display data. Students create a table to write...
Curated OER
Graphing Data
Second graders examine how to make and read bar graphs. In this bar graph lesson, 2nd graders compare bar graphs to pictographs by looking at hair color survey data. They practice making a bar graph and finding the range of the data.
Curated OER
Line Graphs
Seventh graders create a line graph and identify when to use line graphs. In this line graphs lesson, 7th graders analyze the average temperatures of various cities. Students graph the data they collected.


