Curated OER
Childhood Obesity
Students identify a question to generate appropriate data and predict results. They distinguish between a total population and a sample and use a variety of methods to collect and record data. Students create classifications and ranges...
Curated OER
Comparison of Snow Cover on Different Continents
Students use the Live Access Server (LAS) to form maps and a numerical text file of snow cover for each continent on a particular date. They analyze the data for each map and corresponding text file to determine an estimate of snow cover...
Curated OER
Trouble in the Troposphere
Students Use data sets from MY NASA DATA to produce graphs comparing monthly and yearly ozone averages of several U.S. cities. They analyze and evaluate the data and predict trends based on the data. In addition, they discuss and...
Physics Classroom
Action-Reaction Lab
Computer-interfaced motion detectors are required to carry out this inquiry. It is a new twist on exploring motion with plunger carts: they are set back-to-back and then propelled away from each other. Their velocities are measured, and...
Curated OER
Who is Coming to Our House?
Students examine waves of immigration that affected the development of the United States, appreciate variety of countries of origin of immigrants, analyze immigration data, discern patterns in data and communicate finding to classmates,...
Curated OER
Ohio Census 1990 and 2000
Students explore the Ohio census numbers in 1990 and 2000. In this social studies lesson, students use the census data to answer questions.
Curated OER
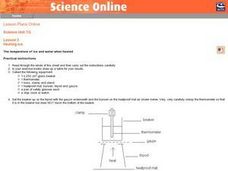
Heating Ice: The temperature of ice and water when heated
Seventh graders read and follow the instructions on the worksheet. They make a table of their results. Students use about 100 cm^3 of water and ice mixture. They heat the water/ice with a Bunsen burner. Temperature is recorded every 30...
Curated OER
Getting to Know the Thirteen Colonies
Fifth graders analyze information about the thirteen colonies. Using the information, they can manipulate and identify a region in which the colony is located. As a class, they make generalizations about the various regions and time...
Curated OER
Collect the Weather Lesson Plan
Students explore the weather. In this weather spreadsheet instructional activity, students keep track of weather patterns as they use instruments and resources to chart the data the collect in spreadsheet form.
Curated OER
Using the Production Possibilities Frontier
Students identify the purpose of models and why economists use them. Using a graph, they practice reading and plotting points. They are introduced to a production possibilities frontier and draw their own from data supplied to them on...
Physics Classroom
From a Feather to an Elephant
It is always a rush to drop objects from great heights, and with this physics experiment, class members will not be disappointed! They drop a single coffee filter from a balcony or table top, record the time it takes to reach the ground,...
Curated OER
Heating of Water: Water Vapour
Seventh graders read the directions printed on their worksheet and follow them carefully. They set up a beaker with a tripod and Bunsen burner under it. They record the temperature of water every 30 seconds. Students graph the data and...
Curated OER
Tracking Your Favorite Web Sites
Ninth graders track the hit count on their favorite web sites. In this Algebra I lesson, 9th graders record the number of hits on their favorite web site for twenty days. Students explore the data to determine if the relation defines a...
Curated OER
Housing Arrangements of the Elderly in Canada
Students examine housing for the elderly in Canada. In this sociology lesson, students analyze Canadian Census data to find out what type of housing seniors of the country live in.
Curated OER
Opinion Surveys
Students examine the factors that affect the accuracy of opinion surveys. They calculate probability and chance using data they have collected. They practice reading tables and graphs as well.
Alabama Learning Exchange
The Water Cycle
Learners identify the stages of the water cycle. They listen to the book "Magic School Bus: Wet All Over," examine the Build Your Own Water Cycle website, predict and measure the amount of water in a jar for a week, and read a short play...
Wild BC
Bearly Any Ice
After reviewing food chains, your class members participate in an arctic predator-prey game that exemplifies the impact of climate change of food availability. If you are in a hurry, skip this lesson, but if you have the time to...
Curated OER
Death by Particles
Emerging epidemiologists define relative risk and read an article about the effect of particulate pollution on the cardiovascular health of women. They record the relative risk values, graph them, and answer analysis questions. This is a...
Curated OER
Weather Awareness
Second graders investigate weather. In this weather lesson, 2nd graders discover how to read a temperature gauge, keep track of the weather, and find out how the weather affects their day. They work individually and in partners to make...
Curated OER
Tony's Spelling Troubles
Students are introduced to the given problem and describe in their own words the situation represented in a bar chart and tally chart. They then use a bar chart and tally chart to make sensible predictions.
Curated OER
Bar Me In
Fourth graders watch a video about constructing bar graphs. They create their own graph and interpret it.
Curated OER
Graphing
Fifth graders create graphs based on climate in South Carolina. They read and interpret information in a chart and construct a graphy from the information in the chart. They create a spreadsheet using Excel and publish 2 graphs.
Curated OER
Graph Your Foot!
Students measure their own foot and place the outline on a graph. They make connections between the size of their foot and the bar graph that represents it.
Curated OER
Rolling with Links
First graders explore geometry by completing a worksheet in class. In this non-standard measurement unit lesson, 1st graders discuss different techniques for measuring items without the use of a ruler. Students read several short stories...


