Curated OER
Graphing Favorite Colors
Third graders collect data and insert it into ClarisWorks to create a spreadsheet/graph of their favorite color. They interpret the data together.
Polar Trec
What Can We Learn from Sediments?
Varve: a deposit of cyclical sediments that help scientists determine historical climates. Individuals analyze the topography of a region and then study varve datasets from the same area. Using this information, they determine the...
Curated OER
How's The Weather?
Students make a box and whiskers plot using the TI-73 graphing calculator. Each student would have their own calculator but they would work in small groups of two or three to help each other enter the data and make the plots.
Curated OER
Fun with Math using Magnetic Force
Sixth graders explore and discuss the effectiveness of magnets in different situations. In this math lesson, 6th graders discuss rate and graphs after exploring with magnets using different restrictions on the magnets. They analyze their...
Curated OER
"who Lives in Your House?"
Fourth graders collect data about the people and animals living in their homes, and the students' shoe sizes. They work in groups to enter the information into a database from which they create graphs. They analyze the data to find the...
Curated OER
Probability: The Study of Chance
Students conduct an experiment, determine if a game is fair, and collect data. They interpret data, then display line graph. They conduct analysis of game for probability.
Curated OER
Zebra Mussel Population Simulation
Students are taught how to format and enter data into an Excel spreadsheet. They make a graph, and interpret graphed data. Students discuss the possible impacts of zebra mussels on the Hudson river. They graph zebra mussel data.
Curated OER
Algebra 1
Students study the functional relationships of a variety of problems. In this functional relationship lesson, students determine the dependent and independent quantities of a given set of data. Students record the data and write it in...
Curated OER
Height versus Shoe Size
Students find a correlation between a person's height and his/her shoe size. They have access to entering data into lists on a graphing calculator and can complete scatter plots. Students read and interpret a scatter plot and use the...
Curated OER
The Tortoise And The Hare
Students use the children's story of The Tortoise And The Hare in order to investigate the graphing of equations. The story is converted to an algebraic word problem for them to solve. Students investigate the relationships of data and...
Curated OER
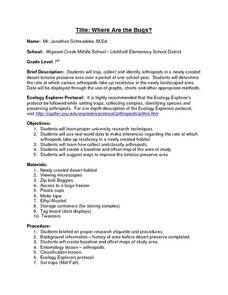
Where Are the Bugs?
Students trap, collect and identify arthropods in a newly created desert tortoise preserve area over a period of one school year. They determine the rate at which various arthropods take up residence in the newly landscaped area. Data is...
Curated OER
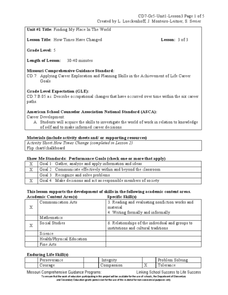
How Times Have Changed
Fifth graders work in small groups to compile job changes. They use data from the list of changes that the group generated together. Students analyze the data to determine: categories of changes, patterns or trends of changes, and future...
Curated OER
Breakfast Cereal - How Nutritious Is Yours?
Students analyze the nutritional value of breakfast cereal in order to make an informed choice. They create a stem and leaf plot which analyzes the nutritional value of the cereal they eat on a regular basis. Students write a letter to...
Curated OER
Invasives and Macroinvertebrates
Students view macroinvertebrates, or discuss previous collection activity. They graph data on macroinvertebrates in the Hudson River. Students discuss the relationship between habitat, environmental changes, and invertebrate diversity or...
Curated OER
Great Tasting Shapes
Fifth graders investigate the concept of median, mode, and range using a simple model for display purposes. They examine different shaped crackers out of a box and identify the ones that occur the most. Then the calculations for the...
Curated OER
Trouble in the Troposphere
Students Use data sets from MY NASA DATA to produce graphs comparing monthly and yearly ozone averages of several U.S. cities. They analyze and evaluate the data and predict trends based on the data. In addition, they discuss and...
Curated OER
Box Plots
Students review the concept of median, explore how to calculate quartiles for any size data set and experience how to build a box plot.
Curated OER
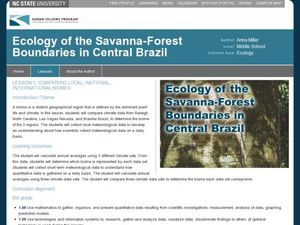
Comparing Local, National, International Biomes
Students calculate averages of climate sets of data. In this ecology activity, students analyze data to determine identity of a biome and collect meteorological data to understand process. Students also compare data sets.
Curated OER
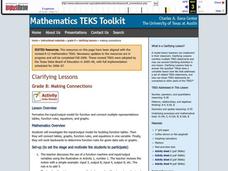
Making Connections
Eighth graders investigate the input/output model for building function tables. From the data, 8th graders connect tables, graphs, function rules, and equations in one variable. They work backwards to determine function rules for given...
Curated OER
Feeding in the Flow
The National Oceanic and Atmospheric Administration (NOAA) has developed a tremendous library of ocean-themed lessons that can be used in a variety of science settings. "Feeding in the Flow" is one of those activities; Its focus is on...
Curated OER
Investigating Median, Mode, and Mean
Students develop strategies to organize data while following teacher demonstration. They calculate the mean, median and mode of a data set while determining the relationships between the numbers. They analyze data from tables and double...
Curated OER
Fame, Fortune, and Philanthropy
With your middle schoolers, develop concepts such as philanthropy, civic responsibility, community service, and common good. Discuss famous philanthropists and what we can each give of our time, talent and treasure to better our...
Curated OER
Laws of Motions
Seventh graders explore the Laws of Motion. They define friction and explain the concept of inertia. Students explain what happens when a force is exerted on an object that is in equilibrium. They state the second and third laws of motion.
Curated OER
Normal Probability Plot
Students analyze the graph of a distribution. In this statistics instructional activity, students define skewed or mound shape distribution as they investigate the data behind the graph. They define and plot outlier as well as normal...


