Curated OER
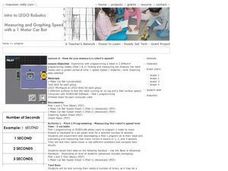
Introduction to Lego Robotics
Students utilize computer programs to operate a simple robot. In this technology lesson, students create robots using Lego pieces and simple motors to move them. Students measure the speed of the robots by running Robolab software on...
Curated OER
The Electric Hearth
Students examine popular media. In this media awareness lesson, students keep logs of their interactions with media and then write an essay regarding the data.
Curated OER
Patterns and Functions
Learners investigate properties of perimeter and area. In this middle school mathematics lesson, students explore patterns in a problem solving context. Learners model and solve problems using various representations for the data as they...
Curated OER
Livelihood of the Times
Students recognize the importance of analyzing historical information and data. In this historical analysis lesson, students collect information for a bar graph, complete a jobs worksheet and define vocabulary.
Curated OER
Control Mechanisms
High schoolers explain how a feedback control system works. They model a feedback control mechanism for controlling water level by observing the flow rate of water in a cylinder. In addition, they graph their data. Script for lesson...
Curated OER
"Stick to It!" Properties of Pressure Sensitive Adhesive Tapes
Students investigate the strength of different adhesives. In this physical science lesson, students compare the force needed to peel adhesive tapes from a surface. They analyze collected data and make a generalization.
Curated OER
3-D Beginning Graphs
Students explore the concept of big and small. They collect objects from the classroom, sort them by size, and create a graph using Duplo stacking blocks.
Curated OER
Involving Community Members, Parents, and Community Agencies in Student Learning
Students predict and estimate the number of moose shot by people between the years of 1986-1990. They analyze data and statistics, construct bar graphs, and conduct research on the Alaskan moose.
Curated OER
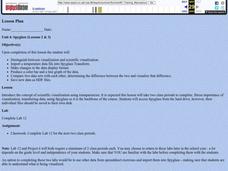
Spyglass
Students distinguish between visualization and scientific visualization. They use the software program Spygalss to create images from two-dimensional arrays of numbers.
Curated OER
Fun With Graphs
First graders read about making graphs and lean how to make graphs using "The Graph Club" software.
Curated OER
Water: From Neglect to Respect
The goal of this collection of lessons is to make middle schoolers more aware of the ways in which they are dependent upon water to maintain their standard of living. Learners compare water use in Lesotho to water use in the United...
Curated OER
Introducing Multiplication
Learners will look at repeating addition examples and view how they can be written as multiplication. They use manipulatives to complete a repeating addition lesson and show it on graph paper. They also chart what they have found and...
Curated OER
Seed Germination
Young scholars explore plants and the scientific method. In this plant growth lesson plan, students follow the steps in the scientific method to perform a seed germination experiment as a whole class. Young scholars work in a group to...
Curated OER
Measuring Mania
Students rotate through stations in the classroom, completing different types of measurements. These measurements are placed into a spreadsheet, and a scatter plot is generated. They type an explanation of their results in correlation...
Curated OER
Technology Integration Lesson Plan: Civil War Spreadsheet
Eighth graders discuss and analyze Civil War data, manually graph data on handout, work with partners to enter data into spreadsheets, and create charts on spreadsheet for each data set.
Curated OER
Graphosaurus
Students complete bar graphing activities with a dinosaur theme. Students discuss their favorite dinosaurs, collect data about the discussion, and make a floor graph of the information. Students complete a dinosaur graph worksheet.
Curated OER
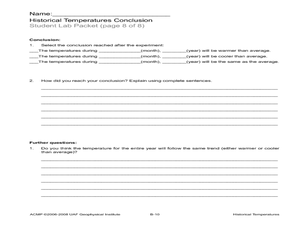
Historical Temperatures
Students research historical regional temperatures for their current season. In this historical weather instructional activity, students conduct weather station and Internet research to learn about historical regional temperatures....
Curated OER
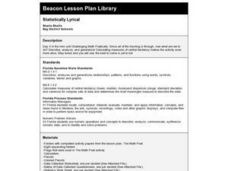
Statistically Lyrical
High schoolers examine and discuss the writing of ratios as fractions and where they can be found in the real world. They complete worksheets and a questionnaire, and calculate the mean, median, and mode scores for the class.
Curated OER
Using 3-D Models for Code Validation with FoilSim
Students use FoilSim to complete the activity to create tables of data sets comparing the lift values for a 3-D model of a symmetrical wing section to the values predicted by the FoilSim software.
Curated OER
Studies of the Eastern Worlds: Population Graphing
Seventh graders participate in several learning/research stations in which they view artwork from various countries of the Eastern world and collect information on the populations of the Eastern countries. They then use this information...
Curated OER
Mathematics Module
Delve into graphing! The concepts covered begin with basic graphing basic coordinates and algebraic expressions on coordinate planes, and build up to graphing linear inequalities and equations. Learners solve and simplify various...
Curated OER
How Long Can You Go?
Eighth graders examine the usefulness of a line of best fit by collecting and graphing data, using a graphing calculator to determine the line of best fit, and making a variety of predictions. They watch a video, then design a...
Statistics Education Web
Sampling in Archaeology
Compare different random sampling types using an archaeological setting. Scholars collect data from an archaeological plot using simple random samples, stratified random samples, systematic random samples, and cluster random samples....
University of Colorado
Happy Landings: A Splash or a Splat?
Huygens spacecraft landed on Saturn's moon Titan in 2005, making it the farthest landing from Earth ever made by a spacecraft. In this hands-on activity, the 12th installment of 22, groups explore how density affects speed. To do this,...


