Curated OER
Introducing Linear Terminology
Ninth graders graph linear equations and inequalities in two variables and then, they write equations of lines and find and use the slope and y-intercept
of lines. They use linear equations to model real data and define to define the...
Curated OER
Linear Functions-Learn Your Lines
Students solve and graph linear equations. In this algebra lesson plan, students collect and plot data on a coordinate plane. They use the CBL and TI calculator to graph systems of equation.
Curated OER
Get a Half-life!
Students use m&m candies as their sample set. They begin by counting the total number of candies to determine their sample size. Students put the candies into a cup and shake them gently before pouring them onto a paper plate. Count...
Curated OER
For The Birds
Seventh graders list the features of an ecosystem and identify local bird species. In this bird lesson students work in groups to formulate a hypothesis and test their theory by collecting and analyzing data.
Cornell University
Beam Focusing Using Lenses
Explore optics using an inquiry-based experimental approach! Young scholars use a set of materials to design and build a unit capable of focusing a beam of light. They experiment with different lenses to determine the best approach to...
Curated OER
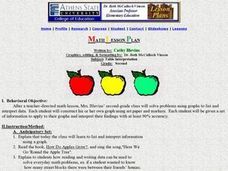
Table Interpretation
Learners solve problems using graphs to list and interpret data. Each student construct his or her own graph using art paper and markers. They be given a set of information to apply to their graphs and interpret their findings.
Curated OER
Whole Lotta Shaking Going On
Students explore earthquake activity in California. They observe the historical data and create databases and graphs of the earthquakes. Students analyze the data and form a hypothesis about future earthquakes.
Physics Classroom
Action-Reaction Lab
Computer-interfaced motion detectors are required to carry out this inquiry. It is a new twist on exploring motion with plunger carts: they are set back-to-back and then propelled away from each other. Their velocities are measured, and...
Curated OER
Probability: The Study of Chance
Students practice the basic principles of probability by conducting an experiment, determining if a game is fair, collecting data, interpreting data, displaying data, conducting analysis, and stating and applying the rule for probability.
Curated OER
Weather Conditions During the Fall Monarch Migration
Students keep detailed weather records during the fall migration of the monarch butterfly. They compare weather conditions to the days they do and do not see monarchs. As a class, they graph and analyze data and send it to a university...
Curated OER
Mr. Cobbler's Shoe Dilemma
Students employ statistics to solve real-world problems. They collect, organize and describe data. They make inferences based on data analysis. They construct, read, and interpret tables, charts and graphs.
Curated OER
Precalculus: Function Models for Real-Life Situations
Students use calculators and "by hand" techniques to compare models of real-life data situations, determine the best model for a situation, and use their models to make predictions.
Curated OER
Solar Kit Lesson #7 Positioning Solar Panels I: Explorations with Tracking
Students track and record data on the Sun's position in the sky and on the output of a solar panel tracking the Sun. On a second day, students graph and analyze the data to identify relationships between (1) the time of day, (2) the...
Curated OER
Purchasing A Used Car
Seventh graders investigate the practice of purchasing a used car with the help of links and resources found in the lesson plan. They conduct research to find the right kind of car using a variety of resources. Students examine data in...
Curated OER
Soil Microbiology- Nitrogen cycle
Students take a virtual trip to a Catfish Aquaculture Pond and analyze soil bacteria to determine how many nitrogen cycle bacteria are present. They graph the number of colonies present and use data to determine ammonium levels in the soil.
Curated OER
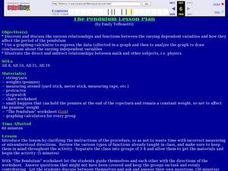
The Pendulum
Students discover and discuss relationships and functions between varying dependent variables and how they affect the period of the pendulum. They use graphing calculator to express the data collected in a graph, to analyze the graph,...
Curated OER
How Do They Relate? Linear Relationship
Students collect information and use a line to represent it. In this algebra lesson, students investigate real world data to see if it makes a line. They graph the line comparing the relationship of the x axis with that of the y axis.
NASA
Determining the Nature, Size, and Age of the Universe
Prompt scholars to discover the expansion of the universe themselves. Using photographs of other galaxies, they measure and then graph the size and distance of each. Finally, they draw conclusions and prove the universe is expanding.
Curated OER
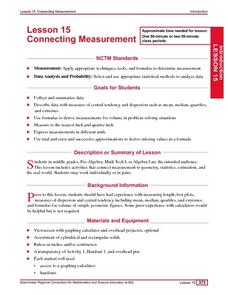
Connecting Measurement
Students participate in activities the connect measurement to geometry, statistics, estimation, and the real world. They collect measurements from their elbow to the tip of their middle finger and make a box plot of the data as well as...
Curated OER
What Are The Chances
Students calculate the probability of an event occurring. In this probability lesson, students differentiate between independent, dependent or compound events. They find the range of the data.
Curated OER
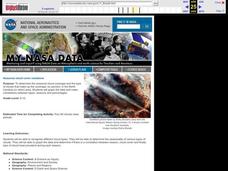
Seasonal Cloud Cover Variations
High schoolers recognize different cloud types. They determine the seaonality of various types of clouds. They graph the data and determine if a correlation exists between season, cloud cover and type of clouds most prevalent during each...
Curated OER
Sizing Pumpkins
Fifth graders study the sizes of pumpkins. They measure and record the diameters of pumpkins. They create five subtraction problems and solve them. They weigh their pumpkins, record the data and select two pumpkins to make a graph of...
Curated OER
Experimenting with Pressure and Volume
Students investigate temperature and pressure with simple laboratory equipment. They use a handheld with sensors and probes to study temperature and pressure. Students explore the nature of gases with respect to temperature and are able...
Curated OER
Different Perspectives of Oregon's Forest Economic Geography
Students map data on employment in wood products manufacturing in Oregon counties. In this Oregon forest lesson, students discover the percentage of people employed in the forest manufacturing industry. Students create a box and whisker...


