Curated OER
Hot Rocks
Learners demonstrate that setting of plaster and cement is a change, which involves a release of heat energy, use data collected experimentally to construct comparison graphs and analyze the graphs to make predictions about future...
Curated OER
Alzheimer's Disease
Investigate Alzheimer's disease. Conduct research using a variety of resources, obtain information, and input the data into a Microsoft Excel spreadsheet. Identify trends in the data and categorize them for an audience.
Curated OER
Poll Positions
Young scholars analyze and graph the results of a nationwide New York Times poll about race in the United States. They poll people in their community regarding their views and experiences, and compare and contrast local and national poll...
Curated OER
Mapping Possible Solutions
Fourth graders propose possible sites for the heart of Florida state capital by mapping collected data onto a Florida state map and recording data in a Travel Log.
Curated OER
Teaching about Increased Conductivity: Are Culverts The Culprits?
Students encounter the complexity of identifying the cause of unusual variations in WOW conductivity data. They propose theories on why there was a sudden increase in conductivity in Ice Lake, Minnesota during July of 1998.
Curated OER
What is the Population Distribution of Cartoon Characters Living On the Pages of Your Newspaper?
Students read various cartoons in their local newspaper and calculate the population demographics, spatial distribution and grouping of the characters. Using this information, they create a population distribution map and share them with...
Curated OER
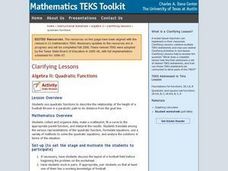
Algebra II: Quadratic Functions
Students collect and organize data, make a scatterplot, fit a curve to the appropriate parent function, and interpret the results. Students translate among the various representations of the quadratic function, formulate equations, use a...
Curated OER
The Closer I Get To You
Pupils explore the law of reflection. Through experimentation and problem solving, they collect and analyze data pertaining to reflection. The data is plotted on a graph and formulas for calculating the x and y values are evaluated.
02 x 02 Worksheets
Inverse Variation
Discover an inverse variation pattern. A simple lesson plan design allows learners to explore a nonlinear pattern. Scholars analyze a distance, speed, and time relationship through tables and graphs. Eventually, they write an equation to...
Curated OER
Heating of Water: Water Vapour
Seventh graders read the directions printed on their worksheet and follow them carefully. They set up a beaker with a tripod and Bunsen burner under it. They record the temperature of water every 30 seconds. Students graph the data and...
Curated OER
Literacy as a Force in the World
Students research and compare economic factors and data mining in Nepal. Students look at data to determine how the Nepalese quality of life compares to other countries and predict whether the literacy rate indicates or influences the...
Curated OER
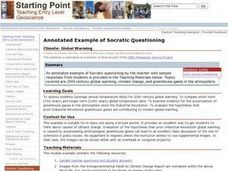
Annotated Example of Socratic Questioning: Climate: Global Warming
Students compare and discuss short-term and longer-term global temperature data. They evaluate data from three sets of graphs and then participate in a structured whole class Socratic discussion on the possible causes of climate change.
Curated OER
Skittles Lab
Students use Skittles as manipulatives to practice computing decimals from fractions, computing decimals into percentages, and creating bar graphs from gathered data.
Curated OER
Solar Kit Lesson #11 - Power Maximum: An Electrical Determination
Collaborative groups connect resistors and solar panels in series and measure electrical resistance, voltage, and current. The objective is to order 16 solar panels from strongest to weakest. They graph current-voltage and power curves...
Curated OER
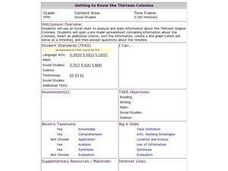
Getting to Know the Thirteen Colonies
Fifth graders analyze information about the thirteen colonies. Using the information, they can manipulate and identify a region in which the colony is located. As a class, they make generalizations about the various regions and time...
Curated OER
Color Me Hot
Seventh graders use the scientific method, to observe, record and analyze the data they gathered. They make observations using their five senses. Students compare, contrast and draw conclusions based on the observations and data...
Curated OER
Food Groups in our Lunch
Students make a graph. In this food groups and graphing lesson, students pack a sack lunch and then work in groups to tally the number of foods from each food group that they have. Students use the data collected to create a graph using...
Curated OER
Weather or Not
Sixth graders explore weather. In this meteorology lesson, 6th graders create weather instruments and compare and contrast weather data.
Curated OER
Ohio Census 1990 and 2000
Students explore the Ohio census numbers in 1990 and 2000. In this social studies lesson, students use the census data to answer questions.
Curated OER
Color Enhanced Maps
Learners download or create maps with numerical weather data. They add isolines and color to create regions on their maps. They explore the visual properties of color palettes and create a visualization applying their knowledge.
Curated OER
Finding Caterpillars
Students examine how animals protect themselves from predators and camouflage themselves. They participate in a simulation in which they locate red and green yarn "caterpillars," organize their data, and generate a bar graph using...
Curated OER
Attributes of Accuracy
Young scholars explain necessity in using accurate instruments when measuring, and how measurements can be checked for accuracy. They make a six-inch ruler, design, test, and evaluate a system to measure work, and produce a table and...
Curated OER
Heating Ice: The temperature of ice and water when heated
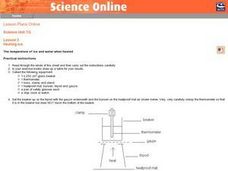
Seventh graders read and follow the instructions on the worksheet. They make a table of their results. Students use about 100 cm^3 of water and ice mixture. They heat the water/ice with a Bunsen burner. Temperature is recorded every 30...
Curated OER
Waves Through Earth: Interactive Online Mac and PC
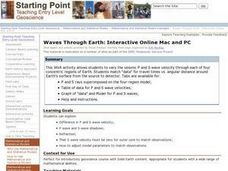
Students participate in a JAVA activity to vary the seismic P and S wave velocity through each of four concentric regions of Earth. They match "data" for travel times vs. angular distance around Earth's surface from the source to detector.


