Alabama Learning Exchange
Inch by Inch
Third graders listen to a read-aloud of Leo Lionni's, Inch by Inch before measuring a variety of items using both standard and metric units. They record the measurement data and follow a recipe for dirt pie.
Curated OER
Global Statistics
Students determine statistics based on data. In this statistics lesson, students use data and record in charts. Students create graphs based on the statistics found.
Curated OER
Aquatic Invertebrates
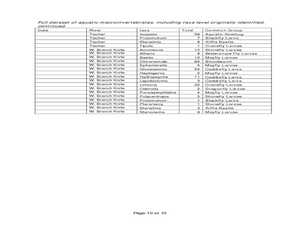
Learners examine the impact that human development has on streams. In this stream sampling lesson students compare macroinvertebrate data and graph it.
Curated OER
Mean, Median, Mode and Range
Fourth graders investigate when to find the mean, median, mode and range. In this statistical concepts lesson, 4th graders collect data, make observations and graph the data. Students verify their work on the computer.
Curated OER
Global Warming Statistics
Learners research and collect data regarding temperature changes for a specific location and find the mean, median, and mode for their data. In this climate change lesson plan, students choose a location to research and collect data...
Curated OER
Probabilities for Number Cubes
Learners explore the concept of probability. In this probability lesson, students roll a six-sided number cube and record the frequency of each outcome. Learners graph their data using a frequency chart and keep tally marks in a...
Curated OER
Box-and-Whisker Plots
Eighth graders measure in feet and inches and convert to explore the relationship between the converted measurements. In this measurement lesson plan, 8th graders use the whisker and box plot to represent the measurement of a cat. ...
Curated OER
Strike a Pose: Modeling in the Real World (There's Nothing to It!)
Adjust this lesson to fit either beginning or more advanced learners. Build a scatter plot, determine appropriate model (linear, quadratic, exponential), and then extend to evaluate the model with residuals. This problem uses real-world...
Curated OER
Quartiles, Percentiles, and Cumulative Frequency
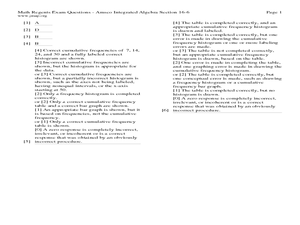
In this statistics lesson, 11th graders are asked to calculate the percentiles, quartiles and cumulative frequency given different graphs and data. There are 6 questions with an answer key.
Curated OER
How Texas is Planning To Manage Its Water
Students research water management strategies in Texas. They analyze projected demand for water in the year 2050, interpret graphs and tables and then discuss the data as part of a written report. They research and map the locations of...
Curated OER
Specific Heat of Metals
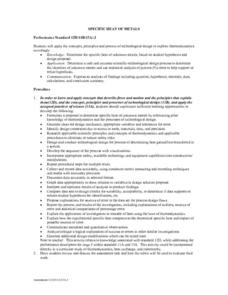
Students determine the specific heat of unknown metals. based on their hypothesis and design proposal. They analyze the findings of the specific heat of the unknown metals. Students complete this by questions, hypothesis, rationale,...
Curated OER
How Trees Contribute to the Water Cycle
In this water cycle instructional activity, 3rd graders conduct an experiment where they observe and calculate how water transpires in different types of trees. Students engage in a class discussion and use Venn Diagrams to compare...
Curated OER
Higher Order Thinking (H.O.T.) Lesson - BIG E
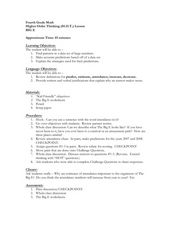
Fourth graders work with patterns while using large numbers. In this patterning lesson, 4th graders go over the definitions of the words: predict, estimate, attendance, increase, and decrease. They complete worksheets in which they track...
Curated OER
Assimilation in America
High schoolers, after reading the novel, "The Joy Luck Club," create a four question survey about assimilation in America. They each ask four members of their family or peers to take the survey. After data is collected, they create...
Curated OER
Urban Effects on Inshore Plankton
Students investigate the effects of urban pollution on plankton. In this plankton and pollution lesson plan, students use samples of plankton collected in urban areas to observe the effects of pollution on plankton samples. They...
Curated OER
Billions of Bubbles
Students conduct an experiment with bubbles. In this observation and comparison lesson, students read Bubbles, Bubbles, Everywhere and conduct an experiment where they test different kinds of liquids to see which is the best for a...
Curated OER
What Are Erosion and Sediments?
Students create experiments in class based on the erosion of Earth. In this erosion lesson, students perform a lab in class replicating the effects of erosion. Students finally draw their own conclusions based on the research performed.
Curated OER
Analyzing Graphs
For this statistics and probability worksheet, students analyze frequency distribution tables or histograms and box and whisker plots. The two page worksheet contains four multiple choice questions. Answers are included.
Teach Engineering
Fun with Air-Powered Pneumatics
How high did the ball go? Engineering teams build a working pneumatic system that launches a ball into the air. The teams vary the amount of pressure and determine the accompanying height of the ball. An extension of building a device to...
Curated OER
Evidence of Change Near the Arctic Circle
Students analyze graphs and make conclusions about climate change. In this climates lesson students produce graphs and identify relationships between parameters.
Curated OER
WebQuest: Thrills and Spills- Pick Your Park!
Students participate in a WebQuest in which they must determine which amusement park is the "median priced" park. Students visit park websites to accumulate prices for parking, activities, restaurants, and gift shops.
Alabama Learning Exchange
What's Your Favorite Chocolate Bar?
Learners complete a math survey. In this math graphs lesson, students complete a survey about their favorite candy bars. Learners create different kinds of graphs using Microsoft Excel to show their results.
Curated OER
Comparison of Two Different Gender Sports Teams - Part 3 of 3 Scatter Plots and Lines of Best Fit
Students create a scatter plot for bivariate data and find the trend line to describe the correlation for the sports teams. In this scatter plot lesson, students analyze data, make predictions,and use observations about sports data...
Curated OER
Graphing Favorite Holidays
Students create spreadsheets and bar graphs based on results of survey of favorite holidays.


