Curated OER
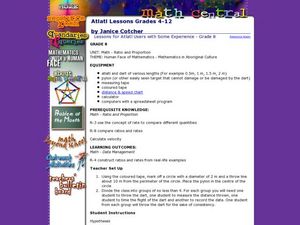
Atlatl Lessons Grade 4-12
Students experiment with velocity, ratios, and rates. In this data management lesson, students throw a dart with and without using an atlatl and collect and record various data. Students construct ratios based on the data and determine...
Curated OER
Cemetery Mapping Lesson
Eighth graders explore historical records. In this cemetery mapping lesson, 8th graders analyze local community data as they examine gravestones and read epitaphs.
Curated OER
Measuring to the Nearest Inch
Third graders use whole numbers and fractions to make connections between abstractions of the mathematical world and the real world. In this fractions and measurement lesson, 3rd graders identify, quantify groups , and measure distances....
Curated OER
What Can You Learn From A Mealworm?
Students collect data from mealworms. For this science and math lesson plan, students gain an understanding of collecting metric data using mealworms.
Curated OER
Blowin' In The Wind
Students predict and hypothesize the reasons for wind movement. After viewing a video, they describe the effects of a high and low pressure system and what makes the wind blow. In groups, they construct instruments that measure air...
Curated OER
POWER OF VOTING
Fifth graders explain the process of a national presidential election by researching through the Internet and holding an election simulation. They collect, graph, and interpret election data. They enhance their computer skills by...
Curated OER
Who's Got Your Power
Students examine and map local sources of energy. They conduct Internet research on their local utility company, identify where their utility company obtains energy, graph the data, and label a map of power plant locations in their state.
Curated OER
Nanofibers: Why Go Small?
Students explore the surface ratio of an object. In this surface area to volume lesson students construct a data table, make calculations and create a graph.
Global Change
Impact of Climate Change on the Desert Pupfish
A fish that lives in the desert? You and your class can meet the desert pupfish as they examine its habitat, the role humans play in diminishing water supplies, and how climate change might impact this fishy friend. There are four short...
Illustrative Mathematics
Paying the Rent
Learning how a bank account works is a useful tool. The exercise in the resource is to deduct rent from a checking account and create an equation from a description. Participants then graph the balance of the bank account versus months...
Curated OER
Remote Sensing
Ninth graders participate in a variety of activities designed to reinforce the concept of light and the electromagnetic spectrum. They research and analyze data from remotely sensed images. They present their findings in a PowerPoint...
Curated OER
Colorimetric Determination of the Concentration of Blue Food Coloring in Sport Drinks
Seventh graders determine the amount of blue food coloring in sports drinks and plot the concentration and absorbance data. They summarize the data and determine why companies need to know the amount of chemicals in their products.
Curated OER
Atlatl Lessons for Grade 8
Eighth graders explore the weapons of the Aboriginal people. In this eight grade math/science lesson, 8th graders collect and analyze data regarding the speed and distance of a dart thrown with an atlatl. Students choose the...
Curated OER
Mean and Median
Pupils identify the different central tendencies. In this probability lesson, students create the correct type of graphs to analyze their data. They make predictions and draw conclusions from their data.
Curated OER
The Candy Color Caper
Young scholars explore the concept of probability. They calculate the probability of an event happening and graph their results. Students determine the probability of winning a sweepstakes. They construct a bar graph to represent all the...
Curated OER
Center of Mass
Students identify the geometric mean of their data. In this statistics lesson plan, students collect data and graph their findings. They identify the mean, range and mode.
Curated OER
Technology Integration Project Weather Unit Plan
High schoolers use a variety of technology-assisted weather observation tools to observe and record local weather. They identify, measure and record weather conditions, summarize types of clouds and make graphs of their observations....
Curated OER
Kinetics of acetone iodination
For this chemistry worksheet, students examine the given concept in order to apply in the laboratory setting. The sheet includes in depth background information.
Curated OER
Don't Be Tricked By Your Integrated Rate Plot
In this chemistry worksheet, young scholars examine the given concept in order to apply in the laboratory setting. The sheet includes in depth background information.
Illustrative Mathematics
Color Week
Practice counting by ones up to 20 with your kindergartners using this colorful class experiment. There are two versions for the lesson. Version 1: The Friday beforehand, send home a notice for the week assigning a different color for...
Curated OER
Factors That Affect Climate
Fifth graders use captured portions of the Internet ("mininets") to perform research into climate. They create graphs of the data recorded using latitude as the independent variable and temperature as the dependent variable.
Curated OER
Let's Take a Chance!
Students investigate probability and the chance of an even happening. In this algebra lesson, students incorporate their knowledge of probability to solve problems and relate it to the real world. They learn to make decisions based on data.
Virginia Department of Education
Radioactive Decay and Half-Life
Explain the importance of radioactive half-life as your high school biologists demonstrate the concept by performing a series of steps designed to simulate radioactive decay. Pupils use pennies to perform an experiment and gather data....
AIMS Education Foundation
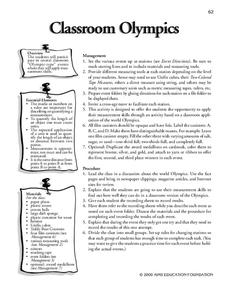
Classroom Olympics
As the Summer Olympics are approaching, incorporate Olympic-type games into the classroom. From straw javelin to cotton ball shot put, these games are sure to keep leaners engaged. The best part is that there is math involved! Pupils...


