Curated OER
Invasives and Macroinvertebrates
Students view macroinvertebrates, or discuss previous collection activity. They graph data on macroinvertebrates in the Hudson River. Students discuss the relationship between habitat, environmental changes, and invertebrate diversity or...
Curated OER
Strange New Planet
Fourth graders gather data and simulate a Mars spacecraft mission using multi-sensory observations.
Curated OER
How Times Have Changed
Fifth graders work in small groups to compile job changes. They use data from the list of changes that the group generated together. Students analyze the data to determine: categories of changes, patterns or trends of changes, and future...
Curated OER
Minority Graduation Rates: A 50-50 Chance
High schoolers read the Civil Rights Project report. Students collect data from graduation rates in their school/district or city. High schoolers compare state and local data. Students discuss and analyze minority graduation rates. High...
Curated OER
A Sweet Drink
Students investigate reaction rates. In this seventh or eighth grade mathematics lesson, students collect, record, and analyze data regarding how the temperature of water affects the dissolving time of a sugar cube. Studetns determin...
Curated OER
Investigating an Enzyme-controlled Reaction: Catalase and Hydrogen Peroxide Concentration
Are you looking for a way to measure cellular respiration? Try it with pureed potatoes. With some standard high school science equipment, biologists can perform an investigation and collect data surrounding byproducts of respiration. You...
Curated OER
Examine Methods of Reporting Research Results
Students analyze a research report and the list of components needed in a research report and then identify those components based on a set of standards using the scientific method. They collect data which can be used for a graphical...
Curated OER
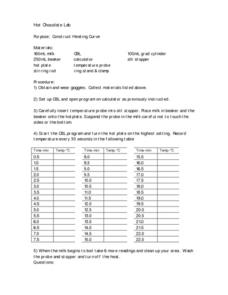
Hot Chocolate Lab
Students wear goggles and collect materials and then set up computer program to use the temperature probes. They insert the probe into the milk recording temperature every 30 seconds and then record the data on the table.
Curated OER
Algebra 1
Students study the functional relationships of a variety of problems. In this functional relationship lesson, students determine the dependent and independent quantities of a given set of data. Students record the data and write it in...
Curated OER
Making a Thermometer
Students observe a demonstration of how a thermometer functions. They apply the scientific method while determining which of three cups hold the coldest water. They write a hypothesis before conducting the experiment and gather data.
Curated OER
Nature and Fitness Trail
Students plan stations for a nature and fitness trail and construct an accompanying e-Book for extended descriptions at each station. Data on the human impact on the environment is gathered in this lesson.
Curated OER
Competition as a Function of Interactions in the Environment
Students set up various feeding stations and observe bird behavior and gather data.
Curated OER
Back In The "Old Days"
Fifth graders collect data during their worker interviews while in groups to compile job changes. They analyze the data to determine the categories of changes, patterns/trends of change and future projections. Each group then develops a...
Curated OER
Shots, Standings, and Shopping
Rates and ratios can easily be applied to real-world situations. Learners explore a series of websites in order to procure comparable data. They define ratios and rates, view videos, and use the internet to explore how ratios and rates...
Alabama Learning Exchange
Bear Factory Probability
By examining a set of dice roll data, statisticians determine the probability of different sums occurring. They visit an interactive website and determine how many different vacation outfits Bobbie Bear will have based on the colored...
Curated OER
Learning to Interview
Second graders view and discuss a modeled interview presented in class. They interview their families and gather data that is later compiled and analyzed as a class.
Curated OER
The Importance of Imports
Learners explore world trade by examining items they find at home and listing countries those items came from. Data is displayed on a map and charted according to continent. They discuss how products are transported.
Curated OER
Gravity Versus the Mighty Egg
Students design, revise and construct a method for protecting an egg from cracking when it is dropped from a height. They work in small groups to develop their protection method and then collect and analyze data as a class when each...
Curated OER
Becoming A Career Detective (Part 2)
Third graders review and expand their discussion of job training and education resources. They work in small groups to find information about the types of training people need to do specific jobs and use data from interviews carried out...
Curated OER
What Are You Eating?
Discover the calorie content of foods by observing how much heat they produce in water. If you have a calculator-based laboratory (CBL™) insturment for collecting data, then this laboratory worksheet will not need any changes. If not,...
Curated OER
Writing Chemical Formulas
Students study how to write chemical fomulas by reviewing the combinations atoms form into compounds. They write a procedure to test various substances and name the compounds and write formulas. As they construct models for formulas and...
Curated OER
Displaying The Data
Students engage in a research project to find information about one's personal family heritage. They collect information by conducting family interviews. Students use the data to create a graph, map, and timeline. Then students take part...
Curated OER
Box Plots
Students review the concept of median, explore how to calculate quartiles for any size data set and experience how to build a box plot.
Curated OER
Creeping
Young scholars observe, measure, and graph a model of slow down slope movement representing soil creep. This task assesses students' abilities to collect, record, and organize data, set up graph axes, plot data points, draw line graphs,...


