Curated OER
Get a Half-life!
Students use m&m candies as their sample set. They begin by counting the total number of candies to determine their sample size. Students put the candies into a cup and shake them gently before pouring them onto a paper plate. Count...
Curated OER
Trouble in the Troposphere
Students Use data sets from MY NASA DATA to produce graphs comparing monthly and yearly ozone averages of several U.S. cities. They analyze and evaluate the data and predict trends based on the data. In addition, they discuss and...
Curated OER
Lines of Best Fit
Learners determine if there is an associationm in a scatter plot of data. They analyze data through predictios, comparisons, and applications. Students calculate the line of best fit using a graphing calculator. They display data in...
Curated OER
Bodacious Buttons
First graders graph a data set. Given a set of buttons, 1st graders sort them into categories using specific attributes. They graph the number of buttons in their set based on their attributes using a variety of graphs. Students share...
Curated OER
More of U.S.
Explore graphical representation of a real-life data set and determine the exponential regression model for the data in your classroom. Learners also compare the estimated value to the given value by determining the percent error.
Curated OER
Analyzing Tree Rings to Determine Climate Change
Students examine how to locate and access data sets. In this climate change instructional activity students import data into Excel and graph it.
Curated OER
Weather instruments
Students explore weather instruments. In this weather lesson, students make rain gauges, anemometers, and barometers following the instructions given in the lesson. Students set up a weather station using their instruments and record and...
Curated OER
Seeds in Fall...Collect Them All!
Classify seeds by attributes such as size, shape and color! Learners classify seeds using a dichotomous key. They identify human behaviors that have a positive impact on preserving seed and plant biodiversity.
Curated OER
Coral Snapshots
Using photographs and a coral reef identification key, junior marine biologists compare changes in coral cover for a No-Take Area and the surrounding unprotected area. The data that is collected is then analyzed for richness,...
Curated OER
Real Estate Lesson: Monthly Payments
Pupils examine real-world data relating to real estate. They conduct Internet research, record data regarding real estate in major cities, graph the data, calculate mortgage payments using a mortgage calculator, and analyze the data.
Curated OER
Show Me!
Students analyze and interpret graphs. In this graphing lesson, students view a video and construct their own graphs (line, circle, bar) from given sets of data.
Curated OER
Education for Global Peace
Fifth graders construct data graphs based upon sets of data. In this graphing instructional activity, 5th graders read the text If the World Were a Village and discuss how types of graphs accurately represent a large population. Students...
Curated OER
String Of Lights
Learners collect, graph and analyze data. In this statistics lesson, students compare data using different types of graphs. They make predictions, draw conjectures as they analyze bulbs used in a holiday light set.
Curated OER
??Data Gathering in the Field??
High schoolers demonstrate that they understand basic operations and concpets, students further use technology to enhance learning, increase productivity and and promote their creativity. High schoolers gain an understanding of the...
Curated OER
Excavating the Trash
Students look at a day's accumulation of recyclable trash from first through fifth grade classrooms, not knowing which classes it came from. After setting up a collection sheet for data, students remove items from the receptacle and...
Curated OER
"Hard" Data from Space
Students use satellite images to analyze development patterns within Baltimore City. They prepare a land cover map for Baltimore indicating the prevalence of impervious surfaces and explore how these patterns affect water pollution.
Curated OER
"The Outsiders" by S.E. Hinton
Middle schoolers estimate the distance in miles between Tulsa, Oklahoma and Manhattan, Kansas. They gather and graph data on gangs in both areas.
Curated OER
Investing
Students collect data on investments and draw conclusions. In this algebra lesson, students analyze exponential graphs as they relate to money. They discuss the cause of an account balance being high or low.
Curated OER
Baseball Math
Students collect data on baseball plays. In this statistics lesson, students graph their data and make predictions based on their observation. They calculate what the probability is that a favorable outcome would happen.
Curated OER
The Probability Scale
Young scholars collect data and make predictions. For this probability lesson, students perform experiments calculating the chance of an event occurring. They draw conclusion based on their data.
Curated OER
Science: Backyard Bugs Data Collection
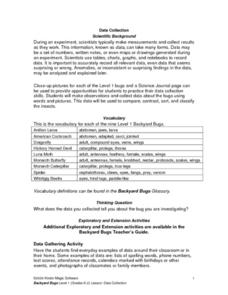
Students practice data collection skills by observing common bugs found in their local environment. Once the data is collected they complete data sheets to compare, contrast, sort, and classify the insects. The lesson includes...
Curated OER
Data Collection Project
Students collect data using email. They calculate the mean, median, mode, range and outliers. They create a graph using the data results. They write five paragraphs to summarize their data.
Curated OER
Worm Bin Project Data Exchange
Students work collaboratively to exchange data with their peers (groups of students at other schools) about their worm bin project. They discuss differing findings and hypothesize reasons for these differences.
Curated OER
Investigation 6 - Collecting Weather Data
Fourth graders collect data for two weeks. They start seeing patterns and make predictions. They can predict what the weather be like the next day and for the next few days. They see if their predictions were correct from the previous day.


