Curated OER
Math: Graphs and Their Symbols
Second graders examine different types of graphs and discover the meanings of the symbols used on them. After gathering data about themselves, their communities, and the world, they use that information to create graphs. Among the...
Curated OER
Counting Candies
Learners count, sort, and classify jellybeans by color. They use their data to create a bar graph. Students are given a small bag of jellybeans, and a worksheet on Counting Candies Tally Chart. They work in small groups. Learners are...
Curated OER
Paper Airplane Science
Fifth graders recognize the need to follow the scientific method carefully and be aware of variables in experiments. In this airplane lesson, 5th graders design and test an airplane, and complete a data sheet. Students retest five times...
Curated OER
The Sun Does What?
Students examine why the sun rises in the east and sets in the west. In this sun lesson, students explore the sunset and shadows. Students prove that the sun's position changes during the day. Students investigate what causes a shadow....
Curated OER
Square Foot Garden
Students plant a garden and keep track of it. In this geometrical garden lesson plan, students collect data from their garden twice a week. They graph their finding and figure out how many square feet of growing space each person needs...
Curated OER
Meet Your Partners
Students become student scientists and work with Internet partners to collect, share, and analyze data needed to draw conclusions about the Waipi'o Valley Stream Restoration.
Curated OER
America's Underwater Treasures Viewing Guide
Students complete a worksheet while watching a video about how humans affect the ocean environment. They discover the need for a practice of balancing fisheries and their fishing practices. They examine how scientists use data to help...
Curated OER
Lobster Roll!
Students collect data by playing a game that illustrates the delicate ecological balance between fishing, fishing regulations and fish populations. They graph and analyze the data and explain how economic decisions can affect the...
Curated OER
Studying Fossils: Hominoid Skull Comparison
Students collect data on the differences in Hominid skulls using acrylic casts of fossil skulls. They measure a series of structures on skulls from six different species then use the data to determine evolutionary relationships between...
Curated OER
Charting the Weather
Students research and conduct non-experimental research, such as journals, the weather channel and the internet, to collect and record data for analysis on weather conditions in the United States and abroad. They identify, pronounce and...
Curated OER
Urban Effects on Inshore Plankton
Students investigate the effects of urban pollution on plankton. In this plankton and pollution lesson plan, students use samples of plankton collected in urban areas to observe the effects of pollution on plankton samples. They...
Curated OER
Scientific Measurement Exercise
Students measure irregularly shaped bones, once using a variety of measurement methods and tools, and then again using standard conventions and metric tape measures. They explore firsthand that standardizing data collection makes...
Curated OER
Inclined Plane and Pulley
Learners describe how inclined plane and pulleys make work easier. In this physics lesson, students calculate work done and mechanical advantage of both simple machines. They collect data from the experiment and construct graphs.
Curated OER
Under the Sea - Ocean Mammals/Fish
Students explore the similarities and differences between ocean mammals and fish. The characteristics of the life forms observed are placed onto a graph. The classroom becomes the botom of the sea and is explored to gain the required data.
Curated OER
Weather
Students communicate how weather affects people, classify objects according to how they are used, and observe and record weather data using symbols.
Curated OER
Weather Patterns and Severe Weather Planning
Students document weather patterns associated with the region where they live. They collect weather data about severe thunderstorms, hurricanes, and tornadoes, and create safety preparation charts for each.
Curated OER
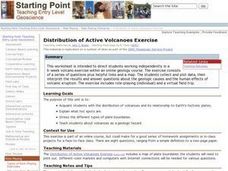
Distribution of Active Volcanoes Exercise
Students collect and plot data, then interpret the results and answer questions about the geologic causes and the human effects of volcanic eruption. They participate in a role-play activity and a virtual field trip, as well.
Curated OER
SAFETY KNOWLEDGE BASE CHANGES
Middle schoolers research and formulate a hypothesis for research to correlate changing safety regulations in regards to personal and environmental safety polices for storage, handling and disposal of chemicals, risk involved in...
Curated OER
What is That White Stuff?
Fifth graders identify, through experimentation, what properties of substance are, determine what variables tested will be, identify constants and variables of experiment, conduct experiment to conclusion with measurable, recorded...
Curated OER
Effects of Water Pollution on Aquatic Organisms
Students investigate water pollution. They develop an understanding of the behavior of organisms, of the structure and properties of matter, and of natural and human induced hazards by conducting lab tests. They present their data...
Curated OER
A Beating Heart
Learners collect and analyze data using percent difference. In this algebra lesson, students relate the concepts of algebra to cardiac physiology.
Curated OER
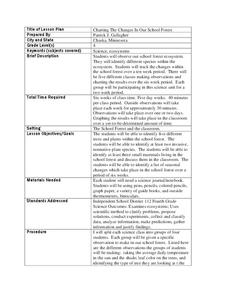
Charting the Changes in Our School Forest
Fourth graders investigate the ecosystem and how forests are disappearing. In this environmental protection lesson, 4th graders analyze the changes in their school for 2 weeks. Students practice identifying trees, birds, and foliage...
Curated OER
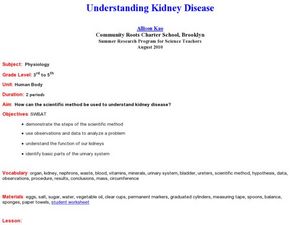
Understanding Kidney Disease
Learners experiment to determine information about kidney function. In this kidney function lesson, students use the scientific method to experiment with eggs, water, salt, sugar, and vegetable oil to simulate kidney function. They...
Curated OER
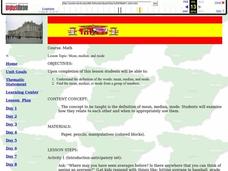
Mean Median and Mode
Students collect data, graph it and analyze it. In this statistics lesson plan, students plot their data and calculate the mean, median and mode explaining how it relates to the data. They define the ways to find the mean, median and mode.


