Curated OER
Histograms and Bar Graphs
Students are introduced to histograms, bar graphs, and the concept of class interval. They use an activity and three discussions with supplemental exercises to help students explore how data can be graphically represented (and...
Curated OER
Line & Scatter (What Would You Use: Part 2)
Learners discuss line graphs and scatter plots and the best situations in which to use them. Using the graphs, they determine the type of correlation between variables on a scatterplot. They create a scatterplot and line graph from a...
Curated OER
Earth's Radiation Budget
Twelfth graders explore the Earth's radiation budget using Earth radiation Budget Experiment (ERBE) data archived at the IRI/LDEO Climate Data Library. They use photometers and light sources to work through several hands-on activities...
Curated OER
Normal Probability Plot
Students analyze the graph of a distribution. In this statistics instructional activity, students define skewed or mound shape distribution as they investigate the data behind the graph. They define and plot outlier as well as normal...
Curated OER
Line of Best Fit
Students identify the line of best fit. For this statistics lesson, students collect and analyze data. They calculate the regression equations and identify the different types of correlation.
Curated OER
Putting Your Best Foot Forward
Third graders measure their feet and their parents' feet, record data on computer-generated graphs, and calculate and record mean, median, and mode.
Curated OER
Super Spreadsheets
Learners develop a spreadsheet containing statistical data. They describe and interpret the data to make conclusions. They review the differences between an unorganized spreadsheet verses an organized one.
Curated OER
Algebra II: Quadratic Functions
Students collect and organize data, make a scatterplot, fit a curve to the appropriate parent function, and interpret the results. Students translate among the various representations of the quadratic function, formulate equations, use a...
Curated OER
Wonderful Watermelons
First graders explore watermelons and collect and sort their seeds. In this watermelons lesson plan, 1st graders read the story Down By The Bay and then weigh, measure, collect seeds, sort, and eat their watermelon.
Curated OER
Tallies Tell It All
Students explore data collection through the use of tally marks. After a demonstration of the use of tally marks students complete various inquires where they create a chart documenting the number of times a desired result happens. They...
Curated OER
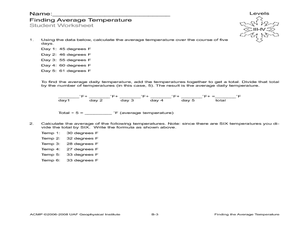
Finding the Average Temperature
Students calculate averages. In this average temperature instructional activity, students collect data and use their problem solving skills to calculate average temperatures.
Curated OER
Mapping Possible Solutions
Fourth graders propose possible sites for the heart of Florida state capital by mapping collected data onto a Florida state map and recording data in a Travel Log.
Curated OER
Probability: The Study of Chance
Students practice the basic principles of probability by conducting an experiment, determining if a game is fair, collecting data, interpreting data, displaying data, conducting analysis, and stating and applying the rule for probability.
Curated OER
Half Life Lab
Seventh graders model radioactive decay using pennies, collect data from their model, apply scientific visualization techniques to their data and create animated models explaining the concept of radioactive half-life.
Curated OER
Connecting Measurement
Students participate in activities the connect measurement to geometry, statistics, estimation, and the real world. They collect measurements from their elbow to the tip of their middle finger and make a box plot of the data as well as...
Curated OER
Graphing Fun In Third Grade
Third graders display information in a graph, table, and chart. In this data lesson plan, 3rd graders look at graphs, tables, and charts, discuss their importance, and make their own.
Curated OER
Consistent Circles
Students create a design of a circle. In this geometry lesson, students identify the measure of the diameter and radius of a circle. They graph and analyze their collected data and write equations based on direct variation.
Curated OER
Can you Find the Expression
Students collect data from measurements and weights for this experiment. In this algebra lesson, students analyze graphs they create form their data to find the expression representing the data. They label which graph provided the best...
Curated OER
Word Power
Fifth graders identify a set of data from a real world problem. For this statistics lesson, 5th graders identify the range, mode, median and mean using some manipulatives. They write words randomizing the letters.
Curated OER
Don't Trash the Earth
Students experience a hands-on environmental science project. They access about recycling as they collect data on their own family's trash production. Students analyze the data with worksheets, chart the data, and present their findings.
Curated OER
Finding the Basal Area of a Forest Plot to Determine Stocking Levels
Learners use graphs and plots to measure the basal area and stocking levels. In this graphing instructional activity students work in the field the use their data to help them complete a lab activity.
Curated OER
Line Graphs and Commercial Costs
Students investigate line graphs. For this middle school mathematics lesson, students compare and contrast different types of graphs and create line graphs based on the data provided.
Curated OER
A Bar of Many Colors
Second graders use colored candies to collect data, construct double bar graphs, and find averages.
Curated OER
Sediment Deposition Lab
Learners set up a stream table, observe erosion, and record data on where various sizes of sediments settle. They draw conclusions as to what kind of sedimentary rock form in what locations.


