Curated OER
Review of the Scientific Method
Learners review the Scientific Method with a hands-on activity. Working with a partner, they hypothesize the number of water drops that fit on the heads side of a penny. They collect data and share their results with the remainder of...
Curated OER
Graph a Panther's Diet
Pupils examine the diet of panthers. In this interpreting data instructional activity, students collect data on the panther's diet and chart the data in bar and pie graphs.
Curated OER
Scavenger Hunt: Simulating Natural Selection
High schoolers simulate natural selection using pinto beans. In this biology lesson, students identify the factors affecting organism evolution. They record data from the experiment and formulate a conclusion.
Curated OER
Hot Rocks
Learners demonstrate that setting of plaster and cement is a change, which involves a release of heat energy, use data collected experimentally to construct comparison graphs and analyze the graphs to make predictions about future...
Curated OER
Discovering Planet X
Students investigate the movements of the planet Pluto. Students participate in a hands-on activity to record data similar to the movements of the planet Pluto. Students compare their data to that found on a website.
Curated OER
Heating of Water: Water Vapour
Seventh graders read the directions printed on their worksheet and follow them carefully. They set up a beaker with a tripod and Bunsen burner under it. They record the temperature of water every 30 seconds. Students graph the data and...
Curated OER
Mean, Median, and Mode
Young scholars calculate measures of central tendency. in this mean, median, and mode lesson, students calculate the measures of central tendency. They organize data, examine and explain the statistics.
Curated OER
Animal Species Richness in Tioga County, PA
Students compile an extensive list of animal species seen throughout Tioga County. In this data collecting lesson, students report daily any animal species seen during the course of their travels and adventures outdoors in Tioga County...
Curated OER
Batteries in Series
Eighth graders examine batteries in a series circuit and the associated voltage. They determine, through inquiry and problem solving, that the total voltage of batteries in a series is the sum of the voltage of each battery. They design...
Curated OER
The Pendulum
Students discover and discuss relationships and functions between varying dependent variables and how they affect the period of the pendulum. They use graphing calculator to express the data collected in a graph, to analyze the graph,...
Curated OER
Solar Kit Lesson #11 Power Maximum: An Electrical Determination
Young scholars identify and implement methods to standardize testing stations that measure solar panel output power. After collecting electrical ouptut data from several solar panels, they plot the current-voltage and power curves. ...
Curated OER
Colors Samples
In this math worksheet, students take the time to count out the colors of the candies. They graph the results and make inferences from the information.
Curated OER
Creek Restoration Project
Students gather and analyze scientific data from a local creek. Over weeks or months, students observe their local environment, collect water samples, and evaluate test results. Extension activities are suggested for evaluating...
Curated OER
Carving Stone with Copper
Students explain the properties of copper as a material for making tools and explain the properties of different chisel points. They gain practice taking notes on qualitative and quantitative data.
Curated OER
Exploring Minerals
Students examine the differences between rocks and minerals. They discover the properties of different minerals and perform hardness tests on minerals. They collect their data and make observations.
Curated OER
Mr. Cobbler's Shoe Dilemma
Students employ statistics to solve real-world problems. They collect, organize and describe data. They make inferences based on data analysis. They construct, read, and interpret tables, charts and graphs.
Curated OER
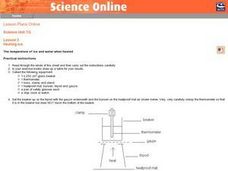
Heating Ice: The temperature of ice and water when heated
Seventh graders read and follow the instructions on the worksheet. They make a table of their results. Students use about 100 cm^3 of water and ice mixture. They heat the water/ice with a Bunsen burner. Temperature is recorded every 30...
Curated OER
Mathematical Models with Applications: The Sounds of Music
Pupils use an electronic data-collection device to model the sound produced by a guitar string. They identify the graph of a periodic situation and use the graph to determine the period and frequency of sound waves.
Curated OER
Protecting Habitats and Species
Students recognize that scientists continuously gather and interpret data to understand and predict relationships among natural phenomena. They research various volcanoes and plot the volcano locations on a world map.
Curated OER
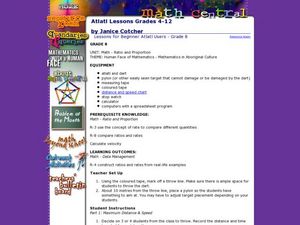
Atlatl Lessons Grade 4-12
Students experiment with velocity, ratios, and rates. In this data management lesson, students throw a dart with and without using an atlatl and collect and record various data. Students construct ratios based on the data and determine...
Curated OER
Measuring to the Nearest Inch
Third graders use whole numbers and fractions to make connections between abstractions of the mathematical world and the real world. In this fractions and measurement lesson, 3rd graders identify, quantify groups , and measure distances....
Curated OER
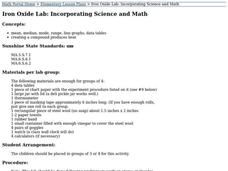
Iron Oxide Lab: Incorporating Math and Science
Students conduct an experiment in small groups, draw conclusions about the amount heat of a compound achieves and practice their data analysis skills.
Curated OER
Different! Diverse! Dynamic! Lesson 1: Late Bloomers
Young scholars examine how people grow and mature at different rates. They create a graph and a timeline to organize the data they collect.
Curated OER
Nature and Fintess Trail
Students investigate how humans impact the environment and compile an organism database into an e-book field guide. They name muscle groups and develop specific exercises to strengthen these groups. Students utilize technology for data...


