Curated OER
EcoTravel Log
Pupils keep travel record over time, analyze data collected and use the information to identify ways in which they can change their behavior to benefit their health and the environment.
Curated OER
Using PING to determine factors of Internet delay
Students use the concepts of PING to examine Internet delay. They discuss why PING is used in the Computer Science industry. They practice interpreting data as well.
Curated OER
Coastal Biodiversity of South Africa
Young scholars investigate the biodiversity found along the coast of South Africa. They conduct research using a variety of resources. They use the information in order to write lab reports with the data. The lesson plan can be adapted...
Curated OER
Pepe Cleaners
Seventh graders gather data to determine the relationships between the base and height of rectangles with fixed perimeters and express the relationships using words and symbols. Students build rectangles with pipe cleaners. They create...
Curated OER
What Does Average Look Like?
Fifth graders, in groups, study the concepts of range, median, mode, and mean through the use of graphs drawn from models. They use manipulatives to represent data that they have collected within groups.
Curated OER
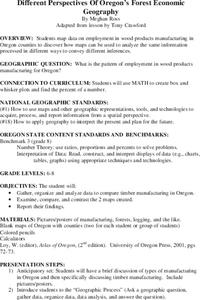
Different Perspectives of Oregon's Forest Economic Geography
Students locate the many forests located in Oregon. In groups, they use the internet to research employment data on wood products made in the state. They discuss how looking at information presented in a different way can change their...
Curated OER
"Region" Out to Everyone: Geographic Regions Defined
Students define the term region. They collect data about New England after watching a short video. They organize the information into a regional concept map. They draw conclusions based upon their data collection and analysis.
Curated OER
Habitat Survey
Students observe a local habitat. They stake out a survey site with string and collect samples for their soil separation and Tullgren funnel tests. In addition, they analyze collected data.
Curated OER
Put Your Heart Into It
First graders sort Valentine candies according to kind. Data is inserted into a spreadsheet and displayed in various graphic formats.
Curated OER
And Around We Go!
Sixth graders conduct a survey and collect data to construct a bar graph that will then be changed into a circle graph. With the bar graph, 6th graders compare estimated fractions and percentages and estimate percentages. With the circle...
Curated OER
Where Do Green Plants Get Energy?
Fourth graders realize that plants need light, water, and carbon dioxide to carry out photosynthesis. They participate in groups of 4 to plant (with materials provided) a test group of beans to compare to the control group, write a...
Curated OER
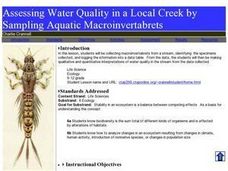
Assessing Water Quality in a Local Creek by Sampling Aquatic Macroinvertabrets
Learners experiment collecting macroinvertebrates from a stream and identify the specimens collected and then log in the information into a data table. From the data, they make qualitative and quantitative interpretations of water quality.
Curated OER
Getting Graphs: Researching Genealogy-A Piece of Pie
Third graders research their genealogy. In this math lesson, 3rd graders collect data and create graphs and charts. A presentation of their findings is given.
Curated OER
Probability: the Study of Chance
Students experiment to determine if a game is fair, collect data, interpret data, display data, and state and apply the rule for probability. Students use a simple game for this experiment.
Curated OER
Lesson Plan for Fontana Mines
Students estimate and compute with rational numbers. They compare, order and convert among fractions, decimals and percents. Students analyze problems to determine if there is sufficient or extraneous data to solve.
Curated OER
Mother May I?
Third graders measure distance using nonstandard units of measure. In this measurement lesson, 3rd graders measure a given distance through the use of the game "Mother May I?" Student gather and compare data on how many "giant steps" and...
Curated OER
Statistics and Shopping
Students examine statistics and data analysis concepts from the practical questions that arise in everyday life.
Curated OER
Sunrise/Sunset
Pupils apply data from a weather-related website to predict patterns in the sunrise and sunset.
Curated OER
Fast Food Survey Using Bar Graphs
Second graders conduct survey and sort data according to categories, construct bar graph with intervals of 1, and write a few sentences about their graphs.
Curated OER
Mapping My Community
Ninth graders are introduced to GPS technology. They complete fieldwork as they visit a specific area of their community to identify and map types of land use in the surveyed area. They use the collected data to create a digital map.
Curated OER
US Historical Climate: Excel Statistical
Students import US Historical Climate Network mean temperature data into Excel from a station of their choice. They are guided through the activity on how to use Excel for statistical calculations, graphing, and linear trend estimates.
Curated OER
Stream Flow in Blacks Creek
Students explore what factors affect the stream flow in a local body of water. They collect data to measure stream flow and discharge and construct a hypothesis concerning the factors affecting stream flow.
Curated OER
Sea Surface Temperature Trends of the Gulf Stream
Students explore the importance of the Gulf Stream. Using a NASA satellite images, they examine the sea surface temperature. Students collect the temperature at various locations and times. Using spreadsheet technology, they graph the...
Curated OER
Are We Alone
Seventh graders collect/analyze data and draw conclusions; support reasoning by using a variety of evidence; construct logical arguments; access information at remote sites using telecommunications; apply the concept of percent;...


