Willow Tree
Histograms and Venn Diagrams
There are many different options for graphing data, which can be overwhelming even for experienced mathematcians. This time, the focus is on histograms and Venn diagrams that highlight the frequency of a range of data and overlap of...
NASA
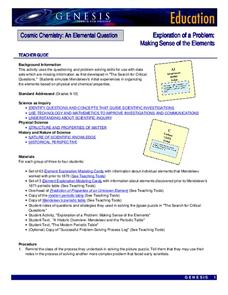
Exploration of a Problem: Making Sense of the Elements
When given too much data to simply memorize, it helps to sort it into manageable groups. The second lesson in the six-part series of Cosmic Chemistry challenges groups of pupils to take a large amount of data and figure out how to best...
Statistics Education Web
Walk the Line
How confident are you? Explore the meaning of a confidence interval using class collected data. Learners analyze data and follow the steps to determine a 95 percent confidence interval. They then interpret the meaning of the confidence...
Howard Hughes Medical Institute
Spreadsheet Tutorial 5: Histogram
A professional-looking histogram is just a few clicks away. The last installment of a five-part Spreadsheet Data Analysis series focuses on histograms. Learners work through a tutorial to see how spreadsheets can help make frequency...
EngageNY
Interpreting Residuals from a Line
What does an animal's gestation period have to do with its longevity? Use residuals to determine the prediction errors based upon a least-square regression line. This second lesson on residuals shows how to use residuals to create a...
Curated OER
Reading Timetable
Word problems, telling time, and reading charts all come together on this page. After reviewing a table of different travel times for a bus, a tram, a taxi, and a trolley, third graders solve word problems about arrival times and stop...
CK-12 Foundation
Line Plots from Frequency Tables: Sleep Cycles
Demonstrate the ease of using a frequency table. An interactive lesson allows learners to create a frequency table efficiently. Challenge questions ask your classes to analyze the data represented in the frequency table.
Pingry School
Comparing Activities of Selected Metals
Don't overreact! A simple experiment demonstrates chemical reactions as scholars mix chemical solutions and metals in a large well plate. They note all changes to the metals, solutions, precipitate, colors, and more. A full data table...
Pingry School
Replacement of Hydrogen by a Metal
As the most abundant element on the earth, hydrogen requires no replacement. Yet scholars learn to replace hydrogen with a metal to liberate the hydrogen gas. A simple procedure and data table include the necessary information and...
Curated OER
Freshman Project-Part 5
In this project instructional activity, 9th graders display their data, the make a graph and they answer analysis and conclusion questions on their experimental design project. They discuss the variables of their experiment, their major...
McAuliffe-Shepard Discovery Center
Global Warming in a Jar
This well-organized lab activity introduces earth science pupils to the greenhouse effect. They will set up two experiments to monitor temperatures in an open jar, a closed jar, and a closed jar containing water. Ideally, you would have...
Towson University
Mystery Disease
How did scientists determine the cause of illness before technology? Science scholars play the role of medical researcher in an engaging guided inquiry activity. Using observations, technical reading, and Punnett squares, learners...
Curated OER
Two Ways to Solve
For this data table worksheet, students solve 4 word problems using the information on a data table about raffle tickets sold by 5 students.
Curated OER
Tables and Data
In this table and data worksheet, students use a given table of ticket sales to answer a set of 8 questions. A website reference for additional activities is given.
Curated OER
Regroup Ones and Tens
In this problem solving instructional activity, students analyze the information on a data table about the sizes of bears. Students use the table to solve 4 problems in which addition with regrouping twice is used.
Curated OER
"Comprehension of Word Problems" Using a Table
Sixth graders practice solving math problems by utilizing a data table. In this number sense lesson, 6th graders create a table using the numerical information about a fictitious farm's inventory. Students complete the empty segments by...
Curated OER
Learning to Make Data Tables
Students construct data tables using the results of previous experiments. In this graphing lesson, students plot data and interpret the results. Students discuss how they organized their data.
Curated OER
Basketball Bounces, Assessment Variation 1
This highly scaffolded, summative assessment tasks learners to choose the model that represents the height of a bouncing basketball given the data in graph and table form. Learners then use the model to answer questions about the...
Curated OER
Basketball Bounces, Assessment Variation 2
This un-scaffold summative assessment tasks learners to use the height of a bouncing basketball, given the data in graph and table form, to choose the model that is represented. Learners then use the model to answer questions about the...
It's About Time
Present-Day Climate in Your Community
So what exactly is climate? This first installment of a six-part series introduces the concept of climate using real-world data tables and topographic maps. The timely lesson includes a comprehensive overview of climate, as well as...
Curated OER
Music and Sports
With so much talent in the classroom, do your musicians and athletes have related interests? This problem has your learners taking data from their classmates to decide whether there is an association between the two activities. The...
Curated OER
Trends of Snow Cover and Temperature in Alaska
Students gather historical snow cover and temperature data from the MY NASA DATA Web site. They compare this data to data gathered using ground measurements from the ALISON Web site for Shageluk Lake. They graph both sets of data and...
Museum of Tolerance
Why is This True?
Are wages based on race? On gender? Class members research wages for workers according to race and gender, create graphs and charts of their data, and compute differences by percentages. They then share their findings with adults and...
Curated OER
Food chains at sea
Fifth graders interpret a table of data about food chains in the ocean. They create a food chain to represent the information on the table. Periwinkles eat seaweed, and crabs eat periwinkles - so who eats crabs? Extend the activity with...
Other popular searches
- Data Tables
- Data Displays
- Displaying Data
- Create Data Table
- Data Table and Graph
- Creating Data Tables
- Science Data Tables
- Creating a Data Table
- Making Data Tables
- Organizing Data in Tables
- Solar System Data Table
- Data Tables and Graphing


