Curated OER
Patterns, Relations, and Functions
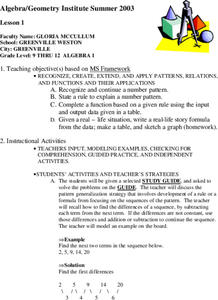
Young scholars investigate the patterns of different data sets of numbers. They use critical thinking skills in order to find the missing numbers in any given set. This lesson helps to develop the skill of number sense.
Curated OER
Bias in Statistics
Students work to develop surveys and collect data. They display the data using circle graphs, histograms, box and whisker plots, and scatter plots. Students use multimedia tools to develop a visual presentation to display their data.
Curated OER
Olympic Line Graphs
Sixth graders examine how to make line graphs. In this Olympic line graph lesson students make line graphs and search the given Internet sites to find data on their summer Olympic Game.
Curated OER
Temperature Bar Graph
Students explore mean, median and mode. In this math lesson, students analyze temperature data and figure the mean, median, and mode of the data. Students graph the data in a bar graph.
Curated OER
Paws in Jobland: Lesson Plan 35 - Catch of the Day
Students study information for fish farm workers given in the form of a chart, in order to practice interpreting data while learning about the career of a fisherman. In this data interpretation instructional activity, students read the...
Curated OER
Probing Under the Surface
Eighth graders use a measuring stick to determine the shape of the inside of the bottom of a box, then apply their knowledge to an additional situation. This task assesses students' abilities to make simple observations, collect and...
Curated OER
Astro-Madness
Students study the different telescopes and instruments used in the Observatory. In this engineering and research lesson students explore telescopes using a website and build data tables about them.
Curated OER
Model and Solve Algebraic Equations
Examine multiple ways to solve algebraic equations. Pupils will generate a problem solving strategy that addresses the prompt given by the teacher. They will then share their problem solving strategy with the class. Graphic organizers,...
Curated OER
Constructing a Periodic Table of Elements
Students create a periodic table of elements. In this chemistry lesson, students work together to build all of the different elements into a complete mini periodic table. They identify similarity and difference of the elements.
Curated OER
Froot Loop Favorites
In this Froot Loop favorites worksheet, students solve and complete 3 different problems that include data tables related to their Froot Loop favorites. First, they determine what fraction of the class voted for each color listed in the...
Curated OER
Using GIS to Construct Water Table Maps and Flow Nets
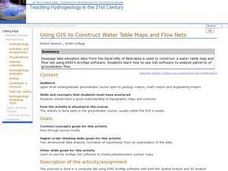
Students examine how to use GIS software to analyze patterns of groundwater flow. Seepage lake elevation data from the Sand Hills of Nebraska is used to construct a water table map and flow net using Esri's Arc Map software.
Curated OER
Epidemiology: Graphing and Analyzing Health Data
Students graph data on fetal and infant mortality rates collected by the Centers for Disease Control and Prevention. They identify trends in the data and propose potential causes for the trends.
Curated OER
Table Interpretation
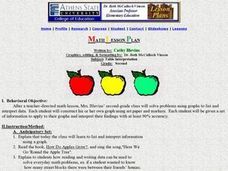
Young scholars solve problems using graphs to list and interpret data. Each student construct his or her own graph using art paper and markers. They be given a set of information to apply to their graphs and interpret their findings.
Curated OER
Function Tables
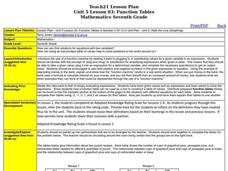
Young scholars identify function using tables of data. In this algebra lesson plan, students create a tale of point and plot on a coordinate plane. They analyze the graph as being a function or not.
Curated OER
Rain Formation
First graders investigate the different water formations by conducting an experiment. In this water properties lesson, 1st graders examine jars filled with ice, rain water, air and snow in their class. Students predict what will happen...
Curated OER
Discovering Magnets and Graphs
Sixth graders investigate averages and statistics by discovering magnet strengths. In this magnet experiment lesson plan, 6th graders utilize different magnets and attempt to attract different materials to them. Students record the...
American Statistical Association
A Sweet Task
Candy is always an effective motivator! A fun math activity uses M&M's and Skittles to explore two-way frequency tables and conditional probability. The candy can serve a dual purpose as manipulatives and experimental data.
Statistics Education Web
I Always Feel Like Somebody's Watching Me
Future statisticians and potential psychics first conduct an experiment to collect data on whether a person can tell if someone is staring at them. Statistical methods, such as hypothesis testing, chi-square tests, binomial tests, and...
NOAA
Tracking a Drifter
Be shore to use this drifter resource. The third installment of a five-part series has learners using the NOAA's Adopt-a-Drifter website to track to movement of a drifter (buoy) in the ocean. Graphing the collected data on a map allows...
NASA
Connecting Models and Critical Questions
Scholars use data to analyze and determine which sets of information need to be counted. They create a model to explain differences among chemical elements using graphs to prove concept mastery.
Kenan Fellows
Man vs. Beast: Approximating Derivatives using Human and Animal Movement
What does dropping a ball look like as a graph? An engaging activity asks learners to record a video of dropping a ball and uploading the video to software for analysis. They compare the position of the ball to time and calculate the...
NOAA
Importance of Deep-Sea Ecosystems – How Diverse is That?
When judging diversity of an ecosystem, both species evenness and species richness must contribute. After a discussion of diversity and a guided example using the Shannon-Weaver function, scholars use the same function on two other...
Curated OER
Sandia Aerial Tram
Your learners analyze a table of real-life data in order to write an equation that best models the information. Exponential, quadratic, and linear rates of changes are all possibilities in this task.
Other popular searches
- Data Tables
- Data Displays
- Displaying Data
- Create Data Table
- Data Table and Graph
- Creating Data Tables
- Science Data Tables
- Creating a Data Table
- Making Data Tables
- Organizing Data in Tables
- Solar System Data Table
- Data Tables and Graphing


