Curated OER
Graphing Family Reading Habits
Second graders collect data from their families about their reading habits and graph them. In this graphing family reading habits instructional activity, 2nd graders interview family members about their reading habits. They then use a...
Curated OER
Graphing
Fifth graders practice using math graphs. In this graphing instructional activity, 5th graders work in groups to develop a topic of their own to represent as a graph. Students collect data and construct a graph for the instructional...
Curated OER
Weather Station Report
In this science worksheet, middle schoolers fill out the data report for the seven different questions. The focus is upon the interpretation of data.
Curated OER
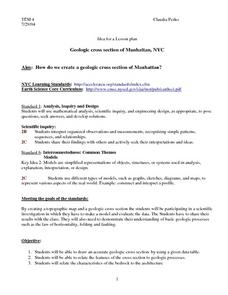
Geologic cross section of Manhattan, NYC
Students draw an accurate geologic cross section by using a given data table. They relate the features of the cross section to geologic processes. Students then relate the characteristics of the bedrock to the architecture.
Curated OER
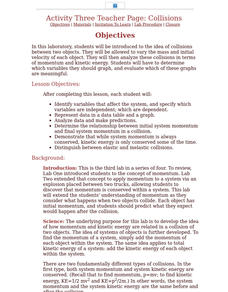
Activity Three Teacher Page: Collisions
Students after completing this lesson, identify variables that affect the system, and specify which variables are independent; which are dependent. They represent data in a data table and a graph and analyze data and make predictions.
Curated OER
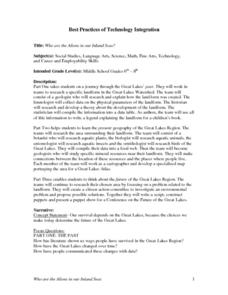
Who Are the Aliens in Our Inland Seas?
Students work in teams to research specific landforms in Great Lakes Watershed, compile information into data table, and write legend explaining landform for children's book. Students then research area surrounding landform, compile...
Curated OER
Build A Skittles Graph
Students explore graphing. In this graphing lesson, students sort Skittles candies and use the color groups to create a bar graph. Rubrics and extension activities are provided.
Curated OER
The Solar Cycle
Students research the solar cycle. In this Science lesson, students use the internet to investigate the solar cycle. Students produce a spreadsheet and graph from the information collected.
Curated OER
Cities and Seasons
Students explore how satellite images show seasonal changes in seven cities in North and South America. Through a sequence of images, they study the green-up and brown-down of the seasons and how seasons change over time. Afterwards,...
Curated OER
Beans and Birds: A Natural Selection Simulation
Young scholars solve the following problem concerning the evolution of seed color in pinto bean plants: "How does natural selection change the frequency of genes or traits over many generations?" They use the constructivist approach to...
Curated OER
Hurricane Frequency and Intensity
Students examine hurricanes. In this web-based meteorology lesson, students study the relationship between ocean temperature and hurricane intensity. They differentiate between intensity and frequency of hurricanes.
Curated OER
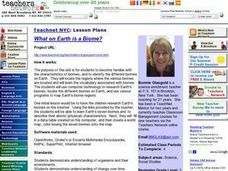
What on Earth is a Biome?
Students explore organisms and their environments. They examine change over time
demonstrate an understanding of physical positions on Earth. They survey earth's diversity, write a report, fill in a data table created on the...
Curated OER
Cyber Chow Combos
Students, after watching the CYBERCHASE episode, "A Day at the Spa,"represent and count combinations of choices using tree diagrams.
Curated OER
Graph a Situation by Making a Table
Students graph scenarios values by making a table. In this algebra lesson plan, students rewrite word problems using algebraic symbols. They make a table of the data, make a graph and analyze the data to extrapolate.
Curated OER
Plotting Data Tables
Learners make a table and plot their data on a graph. In this algebra lesson, students graph piecewise functions using the given equations along with the restricted domain. They calculate the rate of change.
Curated OER
More Graphing Situations by Making a Table
Students calculate rate of change and graph linear functions. In this algebra lesson students write linear functions, make a table of points and graph their data on a coordinate plane. They calculate the rate of change of a graph.
Curated OER
Separate Vacations
Students plot the migration paths of birds using latitude and longitude data from a table.
Virginia Department of Education
Normal Distributions
Pupils work to find probabilities by using areas under the normal curve. Groups work to calculate z-scores and solve real-world problems using the empirical rule or tables.
Serendip
How Do We Sense the Flavors of Food?
We taste with our taste buds, so why do flavors change when we have a stuffy nose? Scholars experiment with taste testing while holding their noses and then while smelling. They record their observations in pairs and come together to...
Polar Trec
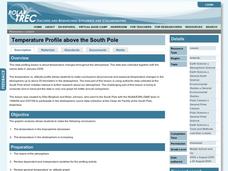
Temperature Profile above the South Pole
Collecting and understanding data is a big part of understanding the world and how it changes. To better grasp what temperatures are changing and how they affect global populations, learners create a graph based on the date provided....
Virginia Department of Education
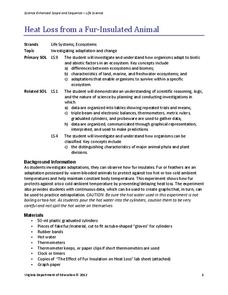
Heat Loss from a Fur-Insulated Animal
How do animals adapt to weather changes? Provide your class with the ability to understand adaptations and body temperature as they participate in this hands on experiment, using fake fur and hot water. Pupils collect data and analyze...
Curated OER
Hopes and Dreams: A Spreadsheet Lesson Using Excel
Fourth graders read "The Far Away Drawer" by Harriet Diller and discuss the story as a class. After discussion, 4th graders create a t-shirt GLYPH about their hopes and dreams,share their information with the class and create spreadsheets.
Curated OER
Microsoft Access Lesson Plan
Third graders read children's literature during the school year and compile a list of books and genres in an Access database. They print out a report of all the different books and genres of they read over the whole school year.
Curated OER
Household Acids and Bases
Ninth graders complete an experiment to determine the pH values of a variety of common household substances. They use red cabbage to find the indicator colors of the pH range. They complete a data table that includes a prediction and...
Other popular searches
- Data Tables
- Data Displays
- Displaying Data
- Create Data Table
- Data Table and Graph
- Creating Data Tables
- Science Data Tables
- Creating a Data Table
- Making Data Tables
- Organizing Data in Tables
- Solar System Data Table
- Data Tables and Graphing


