Curated OER
Displaying The Data
Students engage in a research project to find information about one's personal family heritage. They collect information by conducting family interviews. Students use the data to create a graph, map, and timeline. Then students take part...
Curated OER
"Weather Watch"
Students investigate components of weather and the climate in areas around the country. They analyze data from the University of Michigan weather website, complete a weather watch worksheet, and graph weather data.
Curated OER
Fly Away With Averages
Students discover the process of finding the mean, median, and mode. Through guided practice and problem solving activities, they use a computer program to input data and create a graph. Graph data is used to calculate the mean,...
Curated OER
Solar Kit Lesson #7 - Positioning Solar Panels I: Explorations with Tracking
In this first part of a two-part lesson, learners track and record the sun's azimuth using a solar panel. They graph and analyze the data to identify relationships among the time of day, the altitude and azimuth of the sun, and the...
Illuminations
Circumference and Areas of Circles
Middle and high schoolers listen to a scenario about a puppy and use the scenario to develop formulas in order to find the area of a circle. In this circumference lesson, pupils understand how to find the radius, diameter, area of a...
Curated OER
The Viewing Tube
Looking for an excellent lesson plan that incorporates math, science, and technology? Groups of three students use a viewing tube to perform an experiment, and discover how to organize their data into an Excel spreadsheet. This is...
Curated OER
Cosmic Chemistry: An Elemental Question
Space scientists investigate the cosmic phenomena in order to search for answers to possible origins of the solar system. They consider the concepts of elements and isotopes. Data is analyzed looking at tje abundance of elements...
Curated OER
In the Billions and Linear Modeling
Your learners analyze population data to discern if it best fits a linear scenario. The idea of change by equal differences over equal intervals is enforced in this real-life task.
Virginia Department of Education
Quadratic Curve of Best Fit
Class members create a table of the number of chords that can be drawn given the number of points on a circle. Pupils analyze the data created, find a function to fit to it, and use the function to make further predictions.
Curated OER
Graphing the Forecast - Line Graph or Bar Graph?
Sixth graders compare and contrast bar and line graphs. Using a weather forecast of the area, 6th graders record the high and low temperatures in a table. Students determine and justify the most appropriate graph to display a given set...
Curated OER
Exploring Renewable Energy Through Graphs and Statistics
Ninth graders identify different sources of renewable and nonrenewable energy. In this math lesson, learners calculate their own carbon footprint based on the carbon dioxide they create daily. They use statistics to analyze data on power...
Curated OER
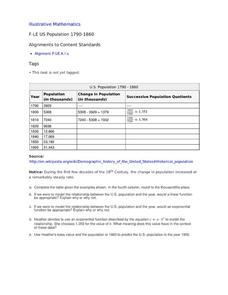
US Population 1790-1860
Your young population scientists analyze a table of values, write a model to represent the real life data, finish the table of data and predict future populations in a collaborative, real-life activity.
Curated OER
Two Views of the Slave Ship Brookes
Actual ship diagrams and a table of voyage data gives young historians an authentic glimpse of on-board experiences during the Atlantic Slave Trade. The class examines a projected diagram of the slave ship Brooks, recording thoughts....
Curated OER
A Closer look at Oil and Energy Consumption
Upper graders analyze basic concepts about the consumption, importation and exportation of the worlds oil production. They create several graphs to organize the data and draw conclusions about the overall use of oil in the world.
EngageNY
Relationships Between Two Numerical Variables
Is there another way to view whether the data is linear or not? Class members work alone and in pairs to create scatter plots in order to determine whether there is a linear pattern or not. The exit ticket provides a quick way to...
Curated OER
Pen Pals
Students collect bird count data at their sites, and share and compare the data collected from two different schoolyards using computer technology.
Curated OER
TE Activity: A Tornado in My State?
Students study data about tornadoes in the United States while completing a worksheet. They develop a bar graph showing the number of tornadoes for the top ten states in the US. They find the median and mode of the data set.
Curated OER
Discovering Pi
Define terminology related to a circle. Practice accuracy in measuring and then create a spreadsheet based on data collected from solving for parts of a circle. Groups can have fun analyzing their data as it relates to Pi.
Curated OER
Wetland vs. Stream Macroinvertebrates
A link to a comprehensive macroinvertebrate guide gives you the information needed to prepare for this field study activity. Sample macroinvertebrates are collected from areas representing different environmental conditions. Junior...
Curated OER
Galaxy Hunter - A Cosmic Photo Safari
Space science stars journey through our night sky and take virtual photos of galaxies to investigate simple random samples. Higher math is used to analyze the data collected. Copy the evaluation/assessment questions onto a handout...
Curated OER
# 21 Measuring Nitrate by Cadmium Reduction
Students design an experiment to evaluate the effects of various treatments on the nitrogen cycle in a freshwater aquarium. They are required to maintain a laboratory notebook of all work, measure the key analytes of the biosystem at...
Curated OER
Nutrition and Food Security
Examine the three basic nutrients and their effects on the body. Fifth graders will research data to construct a bar graph and then demonstrate the relationship between malnutrition and food security. This is a very comprehensive...
Education World
The African American Population in US History
How has the African American population changed over the years? Learners use charts, statistical data, and maps to see how populations in African American communities have changed since the 1860s. Activity modifications are included to...
Curated OER
Shrinky Dinks® Palettes
Here is a fun and clever lesson for teaching physics classes how to calculate wavelength if given the energy and frequency data. On a worksheet, they compute wavelengths using a table of information that you provide. On a paper palette,...
Other popular searches
- Data Tables
- Data Displays
- Displaying Data
- Create Data Table
- Data Table and Graph
- Creating Data Tables
- Science Data Tables
- Creating a Data Table
- Making Data Tables
- Organizing Data in Tables
- Solar System Data Table
- Data Tables and Graphing


