Illustrative Mathematics
The Price of Bread
As part of an initiative to strengthen our young adults' financial understanding, this problem explores the cost of bread and minimum wage since the 1930s. Learners are asked to find the percent increase from each year and compare it...
Curated OER
Schools Going Solar
If your school has a photovoltaic system, you can use this lesson plan to guide learners through an investigation of the factors affecting performance. Familiarize yourself with the data acquisition system, and then provide data for your...
Illustrative Mathematics
Electoral College
A cross-curricular resource that takes the electoral votes and allows your learners to organize and analyze the data. Young voters can determine which states are more influential and interpret the dotplot provided for more data....
Curated OER
Exploration of "Pillbugs"
Fifth graders define vocabulary terms, identify the characteristics of a pillbug, and create a dichotomous key. Then they examine the pillbugs and make observations and record these observations. Finally, 5th graders observe specific...
EngageNY
Probability Distribution of a Discrete Random Variable
Learn how to analyze probability distributions. The sixth installment of a 21-part module teaches pupils to use probability distributions to determine the long-run behavior of a discrete random variable. They create graphs of probability...
Curated OER
Oh, What A Day
Students listen as the teacher reads A Country Far Away. They predict what they will do and what they think their partner student will be doing. Students create a KWL chart for Japan. They collect information about their activities on an...
Curated OER
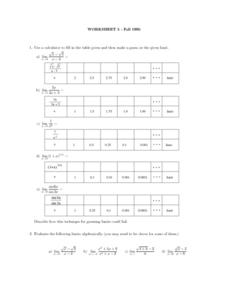
Worksheet 5: Property Limits and the Squeeze Theorem
In this math worksheet, students answer 6 questions regarding given limits in a table of data, properties of limits and the Squeeze Theorem.
Illustrative Mathematics
Track Practice
And they're off! While two runners are at track practice, your mathematicians' job is to find out who leaves the other in the dust. The activity provides a variety of data that can be computed into unit rates for comparisons. Available...
Curated OER
Monopoly Graphs
Students relate the concepts of linear functions to the game of monopoly. For this algebra lesson, students solve problems with ratio and proportion. They collect data and graph it.
Curated OER
Baseball Relationships - Using Scatter Plots
Students use graphing calculators to create scatter plots of given baseball data. They also determine percentages and ratios, slope, y-intercepts, etc. all using baseball data and statistics.
Curated OER
Yummy Math
Young mathematicians use bags of Skittles to help them gain practice in graphing and organizing data. They work in pairs, and after they have counted and organized their Skittles, they access a computer program which allows them to print...
Curated OER
Matrix Operations
Two real-world activities to practice adding, subtracting and multiplying matrices to problem solve. Data from several Pro football quarterbacks is used in one activity to make some predictions based on their stats. Then the class takes...
Curated OER
Do I Have What it Takes to be an Entrepreneur - and is My Community Ready?
Discover the attributes of entrepreneurs and define what entrepreneurship is while examining data based on local businesses. Learners determine whether their community is supportive of entrepreneurs as they research economic development...
Curated OER
Scatter Plots
Seventh graders investigate how to make and set up a scatter plot. In this statistics lesson, 7th graders collect data and plot it. They analyze their data and discuss their results.
Curated OER
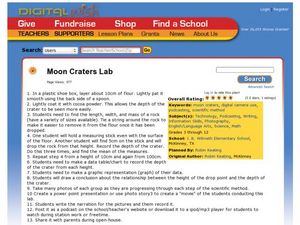
Moon Craters Lab
Students explore characteristics of mass. For this scientific inquiry about mass lesson, students drop rocks of different weights from various heights and record the depth of the "crater" created. Students record their findings on a...
Curated OER
Make Me Metric
Sixth graders explore standard and nonstandard measurement. In this measurement lesson plan, 6th graders estimate the lengths of different objects and write about their observations during measuring. Students work in groups to measure...
American Chemical Society
Using Color to See How Liquids Combine
Blue-tinted water is added to unknown liquids that have been tinted yellow to find out how they interact. This is a memorable activity that is part of an investigation on the properties of liquids, which is part of a unit on the...
Curated OER
INTRODUCTION TO THE PERIODIC TABLE
Students identify the scientist who first wrote the Periodic Table, identify the scientist who amended the Table, state (or write) specific data relating to the history of the Periodic Table, identify at least five elements, and two...
Curated OER
Displaying Data
Learners create a display map with data from a previous lesson. They incorporate graduated marks that identify areas of the school grounds that are good for planting based on density.
Curated OER
Impact!!
Students perform a science experiment. In this algebra lesson, students collect data from their experiment and create a graph. They analyze the graph and draw conclusion.
Curated OER
Savings Planning Using Tables, Line Graphs and Early Proportionality
Students use proportional reasoning to make a chart of daily savings transactions and balances. In this accounting lesson, students read word problems and complete three handouts about a bidding and accounting problem. Students finish...
Curated OER
Survey Says...
Students practice taking surveys to answer different questions about radio. In this communications lesson, students brainstorm to create questions they can ask strangers about how often they listen to their radio. Students turn the...
Curated OER
Antarctica’s Melting and the Affect it has on the Ocean
Students calculate how much mass is lost and gained by Antarctica yearly. In this earth science lesson, students graph and analyze data from the given handout. They explain how this affects the world climate.
Curated OER
Race and Ethnicity in the United States
Students explore race and ethnicity as it is defined by the U. S. Census Bureau. They compare data from 1900, 1950, and 2000 and identify settlement patterns and changes in population. In groups, they map these changes and discuss...
Other popular searches
- Data Tables
- Data Displays
- Displaying Data
- Create Data Table
- Data Table and Graph
- Creating Data Tables
- Science Data Tables
- Creating a Data Table
- Making Data Tables
- Organizing Data in Tables
- Solar System Data Table
- Data Tables and Graphing


