NASA
Launch Altitude Tracker
Using PVC pipe and aquarium tubing, build an altitude tracker. Pupils then use the altitude tracker, along with a tangent table, to calculate the altitude of a launched rocket using the included data collection sheet.
Illustrative Mathematics
US Garbage, Version 1
An interesting example of a discrete function and how it is applies to the real world. This could easily make a good collaborative lesson with an environmental science class. Practice reading a table and drawing a scatter plot make up...
Virginia Department of Education
Work and Power
Assist your class with correctly calculating the values for force, work, and power as they determine the amount various activities require. They gather data and participate in a group discussion to compare results upon conclusion of the...
Wisconsin Online Resource Center
Oversized Inch
Each member of the class creates their own paper ruler. Using their ruler, kids walk around the room measuring the objects you've specified. Discuss how items should be measured to the 16th of an inch, the smallest unit on their ruler....
Virginia Department of Education
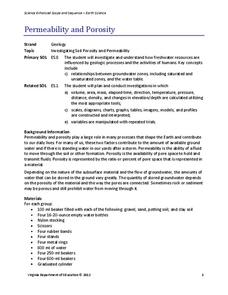
Permeability and Porosity
Covering both permeability and porosity, scholars perform a hands-on experiment testing various soil types. The material includes a pre-lesson worksheet to help focus pupils on the task at hand.
Western Kentucky University
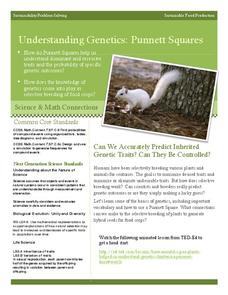
Understanding Genetics: Punnett Squares
Can scientists really predict genetic outcomes or are they simply making a lucky guess? Scholars first learn about Gregor Mendel and how to make Punnett squares. Then they extract DNA from a strawberry in a lab with included conclusion...
University of Wisconsin
Follow the Drop
Young surveyors look for patterns in water flow around campus. Using a map of the school (that you will need to create), they mark the direction of the path of water. They also perform calculations for the volume that becomes runoff. The...
Curated OER
When Dinosaurs Ruled the World
Students graph the varying sizes of dinosaurs. In this math and dinosaur lesson, students view dinosaur models and compare the different shapes and sizes of the dinosaurs. Students complete a dinosaur math activity, read The Dinosaur...
Curated OER
Modeling Linear Relationships
Young scholars graph lines using the slope and y-intercept. In this algebra lesson, students create data using tables and equations. They use their data to make predictions and draw conclusion.
Curated OER
Latitude
Young scholars examine the theory of finding latitude and discuss the uses of an astrolabe, cross-staff and octant. They determine an Astronomical Table for their classroom.
Curated OER
Investigation - Looking For Triangles
Seventh graders investigate a series of triangles, looking for patterns and generalizing what they have found. They analyze the pattern data and organize it into a table and graph. Students identify the relationship and discover the rule...
Curated OER
Capture/Recapture
Students use proportions to estimate the size of populations. They describe the data with using a graph or table of the estimate. Students use descriptive statistics to calculate mean, median, and mode. They also compare and contrast an...
Curated OER
Plugging Into The Best Price
Examine data and graph solutions on a coordinate plane with this algebra lesson. Young problem-solvers identify the effect of the slope on the steepness of the line. They use the TI to graph and analyze linear equations.
Curated OER
Germs Experiment 2
Students express artistic ideas thru art glitter and science. Students experiment with the theory of how germs spread. Students summarize findings in an art format. Students work in groups to analyze data.
Curated OER
Hypothesis Testing
Learners investigate the finding of a hypothesis and how it can be tested.For the experiment they will be using the concept of probability. Students design an experiment and test the hypothesis. Then the results are graphed showing the...
Curated OER
ACT Science Reasoning Test
The types of scientific information that need to be analyzed in the ACT test are presented here. Tips and techniques for completing the research, data, viewpoints, and multiple choice questions will help your class and their expectations.
Curated OER
Election Poll, Variation 2
When a random sample isn't enough, your math class can compare the data from a physical simulation to decide if the probability is still likely. The lesson is part of a probability series that focuses on one question and different ways...
Curated OER
Using an Amortization Table
Students search the Internet to find a site that contains an amortization table and make a hypothesis about the results of changing time and rate. They examine the affects of time and rate on a mortgage and discuss the difference in the...
Curated OER
Creating a Thematic Map Using S'COOL Data
Students observe weather patterns, collect data, and make a weather predictions for various locations on a map.
Curated OER
The Periodic Table
Eleventh graders examine the history and development of the periodic table and properties of elements. They complete worksheets, take notes during a teacher-led discussion, and produce their own periodic table.
Illinois State Board of Education
Common Core Teaching and Learning Strategies
Here's a resource that deserves a place in your curriculum library, whether or not your school has adopted the Common Core. Designed for middle and high school language arts classes, the packet is packed with teaching tips, materials,...
Consortium for Ocean Science Exploration and Engagement (COSEE)
Carbon Dioxide & Krill: Impacts
What effects do temperature and carbon dioxide levels have on the zooplankton of Antarctica? This concluding lesson plan in a short unit on climate change and the ocean helps environmental scientists answer these questions. After...
Towson University
Mystery of the Crooked Cell
Can your class solve the Mystery of the Crooked Cell? Junior geneticists collaborate to learn about sickle cell anemia in a fascinating lesson plan. The included materials help them to examine the genetic factors behind the disease...
Curated OER
Do You Have Change?
Students analyze data and complete a worksheet about land use change in a coastal region. In this land use lesson, students discuss events that cause land use changes in coastal areas. They construct a change table to summarize data on...
Other popular searches
- Data Tables
- Data Displays
- Displaying Data
- Create Data Table
- Data Table and Graph
- Creating Data Tables
- Science Data Tables
- Creating a Data Table
- Making Data Tables
- Organizing Data in Tables
- Solar System Data Table
- Data Tables and Graphing


