Curated OER
Entrance Ticket
Young scholars collect data on different events and word problems. In this algebra lesson, students use a table to organize their data. They graph their coordinate pairs on a coordinate plane and make predictions.
Curated OER
Statistical Diagrams
In this statistics worksheet, students explore five activities that require analysis and interpretation of maps, charts, and scatter plots. The six page lesson includes five activities or experiments with short answer...
Curated OER
Graphing
Fifth graders practice using math graphs. In this graphing lesson plan, 5th graders work in groups to develop a topic of their own to represent as a graph. Students collect data and construct a graph for the lesson plan.
Curated OER
Maglev Train
In this statistics worksheet, learners collect data on train time using speed and time. They differentiate between the upper and lower bound of their data. There are 7 questions on 2 pages.
Curated OER
Weather Station Report
In this science worksheet, students fill out the data report for the seven different questions. The focus is upon the interpretation of data.
Curated OER
Angles and Arcs
In this angles and arcs worksheet, 10th graders solve 18 various types of problems related to determine various angles and arcs of a circle. First, they find the measure of each angle and arc of the first circle shown. Then, students...
Curated OER
Reading and Making Pie Graphs
For this pie graphs worksheet, students solve 10 different problems that include reading a pie graph. First, they use the pie graph to respond to 5 questions that follow. Students determine the year that had the smallest and largest...
Curated OER
My Test Book: Standard Form and Reading Tables
In this math skills worksheet, students solve 10 multiple choice math problems that require them to write numbers in standard form and read tables. Students may view the correct answers.
McGraw Hill
Population Biology
The carrying capacity of an environment varies based on the organisms that live there. Using a virtual lab simulation, scholars test two protists living in their own environments and a third environment where both protists live....
Curated OER
Dice Games
Games and activities are wonderful for igniting interest in nearly any topic. With a pair of dice, your class will practice their basic math and social skills at the same time. Learners battle it out to see who can roll only odds or only...
Curated OER
Mt. Whitney to Death Valley
This is an intriguing problem that brings together real-world data, technology, and mathematical problem solving. If visibility wasn't an issue, could you see from the highest point in the lower 48 states, Mt. Whitney, to the lowest...
Curated OER
A Solubility Curve for Potassium Nitrate
Step-by-step laboratory instructions are listed so that chemistry explorers can consider the solubility of potassium nitrate. They combined their results with other lab groups' results and then graphed the data to display the solubility...
Curated OER
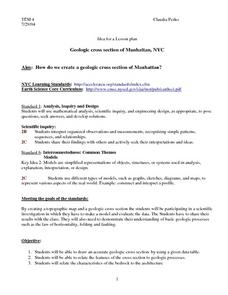
Geologic cross section of Manhattan, NYC
High schoolers draw an accurate geologic cross section by using a given data table. They relate the features of the cross section to geologic processes. Students then relate the characteristics of the bedrock to the architecture.
Curated OER
An Inventory of My Traits
In this biology activity, students identify and describe a number of easily observable genetic traits and compare the traits they have with other students. Then they identify and describe that some traits are common while others are not...
Curated OER
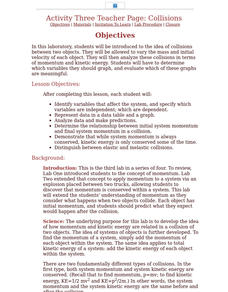
Activity Three Teacher Page: Collisions
Young scholars after completing this lesson, identify variables that affect the system, and specify which variables are independent; which are dependent. They represent data in a data table and a graph and analyze data and make predictions.
Curated OER
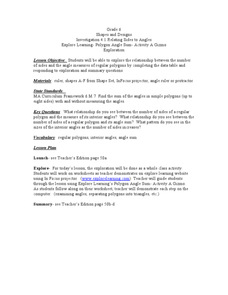
Shapes and Designs
In this shapes and designs worksheet, 10th graders solve and complete 6 different types of problems. First, they fill in the first two columns of the table show with their shapes. Then, students measure the interior angles of each...
Curated OER
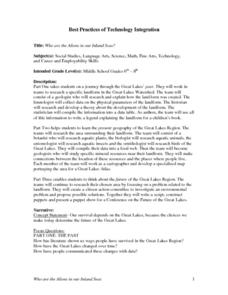
Who Are the Aliens in Our Inland Seas?
Middle schoolers work in teams to research specific landforms in Great Lakes Watershed, compile information into data table, and write legend explaining landform for children's book. Students then research area surrounding landform,...
Curated OER
Build A Skittles Graph
Students explore graphing. In this graphing lesson, students sort Skittles candies and use the color groups to create a bar graph. Rubrics and extension activities are provided.
Curated OER
The Solar Cycle
Students research the solar cycle. In this Science lesson plan, students use the internet to investigate the solar cycle. Students produce a spreadsheet and graph from the information collected.
Curated OER
Cities and Seasons
Students explore how satellite images show seasonal changes in seven cities in North and South America. Through a sequence of images, they study the green-up and brown-down of the seasons and how seasons change over time. Afterwards,...
Curated OER
DNA, RNA, Protein Synthesis, & Mutation
In this biology worksheet, students identify and label the diagram shown by stating what each part of the diagram represents on the line. Then they use the DNA strand as the original strand and complete the data table. Students also...
Curated OER
Beans and Birds: A Natural Selection Simulation
Students solve the following problem concerning the evolution of seed color in pinto bean plants: "How does natural selection change the frequency of genes or traits over many generations?" They use the constructivist approach to...
Curated OER
Hurricane Frequency and Intensity
Students examine hurricanes. In this web-based meteorology lesson, students study the relationship between ocean temperature and hurricane intensity. They differentiate between intensity and frequency of hurricanes.
Curated OER
Reading the Language of the Street
This is a very helpful one-page worksheet in which students can practice reading a stock market ticket. Using a data table that's given, students analyze different well-known stocks and their history.
Other popular searches
- Data Tables
- Data Displays
- Displaying Data
- Create Data Table
- Data Table and Graph
- Creating Data Tables
- Science Data Tables
- Creating a Data Table
- Making Data Tables
- Organizing Data in Tables
- Solar System Data Table
- Data Tables and Graphing


