Curated OER
Teenage pregnancy trends in Canada
Young scholars analyze demographic data relating to teen pregnancy trends. They develop skills to locate and interpret data. They discuss the factors that influence teenage pregancy such as social, economic, and educational issues.
Curated OER
Let's Keep Track of Grades
Students participate in a technology project. This lesson is a hands-on spreadsheet project where students are responsible for keeping track of their grades for class. The students learn to enter data into a spreadsheet, create...
Mathematics TEKS Toolkit
Grade 6: Exploring c/d = pi
Introduce your math class to the perimeter of a circle. Teach them that pi describes the relationship between the circumference and the diameter. As a hands-on investigation, pairs or small groups use string to compare these two values...
Curated OER
Ocean Currents and Sea Surface Temperature
Students use satellite data to explore sea surface temperature. They explore the relationship between the rotation of the Earth, the path of ocean current and air pressure centers. After studying maps of sea surface temperature and ocean...
Curated OER
Analyzing the Job Market for Babysitting in Your Neighborhood
Students conduct research on a neighborhood in Canada. In this data analysis lesson, students use data from the 2006 Canadian census to draw conclusions about a population group.
Curated OER
Global Warming Statistics
Learners research and collect data regarding temperature changes for a specific location and find the mean, median, and mode for their data. In this climate change lesson plan, students choose a location to research and collect data...
Curated OER
Distribution of children living at home
Students use E-STAT to examine demographics. In this social demographics lesson, students use statistical data to determine if a particular family is in need of assistance. Students will discuss social and educational policies and...
Curated OER
Cars on the Curve
Second graders, using two dice, participate in a car race game called Cars on the Curve. They predict which car wins the game and records it in their Data Diary.
Curated OER
Canada and its Trading Partners
Students identify the relationship between Canada and its trading partners. They use two data sources, Canadian Statistics and E-STAT, on the Statistics Canada website to explore the growing importance of trade in general.
Curated OER
Internet Shopping Business Idea
Students create their own Internet business based on data they find concerning trends in Internet shopping. They discuss advantages and disadvantages to selling specific products and/or services over the Internet.
Curated OER
What Do We Learn From the Repartiation of Alaska Native Artifacts?
Students observe and evaluate evidence of Alaska Native cultural symbols and artifacts. They research historical data from a variety of primary resources, including the Harriman expedition journals, related web sites, oral accounts,...
Curated OER
Creating an Enzyme-Substrate Model
Students explore the reaction rates of an enzyme-mediated reaction through experimentation. In small groups, they use everyday objects to demonstrate the effects of environmental variables on enzyme function.
Students graph and...
Curated OER
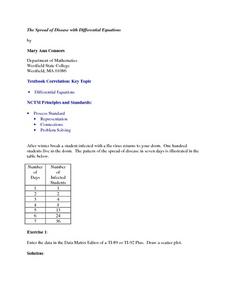
The Spread of Disease with Differential Equations
Twelfth graders solve problems using differential equations. For this Calculus lesson, 12th graders analyze data regarding the spread of a flu virus. Students use the symbolic capacity of the TI-89 to develop a model and analyze the...
Curated OER
Mapping Exercise
In this mapping worksheet, students are given data of children exposed to health risks and their geographical location. Students plot each child's home and the risk factors using an (x, y) grid. They answer 2 questions about the...
Curated OER
Healthy Water!?
Students test water for its quality and record their information.In this water quality activity, students investigate water for pH, macro invertebrates and identify its characteristics. Students complete worksheets on their data for...
Curated OER
College Costs are on the Rise
Young scholars examine college costs in different states. In this college cost lesson, students create a table and determine the average cost of college for the states listed. They organize the data into measurement categories. Young...
Curated OER
Lines of Fit
Students graph an equation and analyze the data. In this algebra lesson plan, students graph scatter plots and identify the line of best fit using positive correlation, negative correlation an d no correlation. They apply their data...
Curated OER
Pick's Theorem
Students investigate polygons and their lattice. In this calculus lesson, students record data using different methods. They analyze their data and draw conclusions based on the relationship between the area and the interior lattice.
Curated OER
Population Pyramids
Learners work with and make population pyramids. In this population pyramid lesson, students use census data to make population pyramids for China, India, and the United States. They use the information to determine why jobs are leaving...
Curated OER
How Do We Solve the Problem of Wildlife on Our Roads?
Students analyze data on elk ecology and movements across the highway. In this ecology lesson, students research ways to save them from highway collisions. They write a report and present their findings in class.
Curated OER
What Are My Chances?
Students calculate probability. In this lesson on probability, students use given data to calculate to chances of a given event occurring. Many of the calculations in this lesson are applicable to daily life.
Curated OER
Volcano Hazards
Students research volcano hazards in VolcanoWorld, make a paper volcano, produce and watch the effects of ashfall, produce and watch the effects of a mudflow and create a hazard map by plotting historical ashfall/mudflow data from Mount...
Curated OER
Teaching Radioactive Decay: Radioactive Half-life And Dating Techniques
Students generate a radioactive decay table for an imaginary element using a box filled with pinto beans and M&M's. They use their data to plot a decay graph, develop the concept of half-life, and use the graph to "age" several samples.
Curated OER
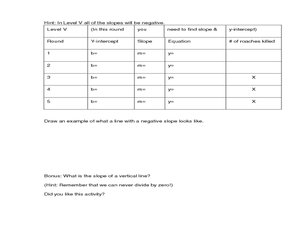
Cockroach Slope
Students identify the slope of linear functions. In this slope lesson, students collect data and graph it. They write equations with no more than two variables and use technology to explain their data.
Other popular searches
- Data Tables
- Data Displays
- Displaying Data
- Create Data Table
- Data Table and Graph
- Creating Data Tables
- Science Data Tables
- Creating a Data Table
- Making Data Tables
- Organizing Data in Tables
- Solar System Data Table
- Data Tables and Graphing


