Curated OER
A Picture is Worth a Thousand Words: Introduction to Graphing
Students practice graphing activities. In this graphing lesson, students discuss ways to collect data and complete survey activities. Students visit a table and graphs website and then a create a graph website to practice graphing.
Polar Trec
Bering Sea Fabulous Food Chain Game
In spring, the Bering Sea turns green due to phytoplankton, which live at the surface, experiencing a population explosion. Groups of scholars play a food chain game, writing down food chains as the game is played. After five to six...
PHET
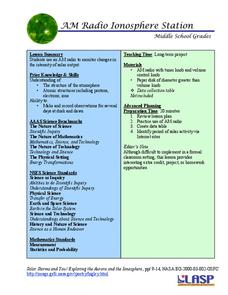
AM Radio Ionosphere Station
Tune in! Young scientists use an AM radio at home to monitor solar output. The long-term project would be ideal in a flipped classroom or as an out-of-class project.
University of Colorado
Looking Inside Planets
All of the gas giant's atmospheres consist of hydrogen and helium, the same gases that make up all stars. The third in a series of 22, the activity challenges pupils to make scale models of the interiors of planets in order to...
Cornell University
Thin Films
Combine mathematics and science to calculate measurements of unmeasurable materials. Individuals use knowledge of density and volume to determine the thickness of the film used in production. They also apply stoichiometry to determine...
Kid Zone
Groundhog's Day Graphing
This Groundhog's Day, challenge scholars to predict, estimate, tally, and graph in a weather-themed lesson in which class members play the role of the groundhog to forecast the weather come February second.
Santa Monica College
Titration of Vinegar
Titration calculations require concentration. The 10th lesson in an 11-part series challenges young chemists to use titration in order to determine the molarity and mass percent in concentrated vinegar. Analysis questions encourage...
Towson University
The Wildlife Forensics Lab
Can science put an end to the poaching of endangered species? Show your young forensic experts how biotechnology can help save wildlife through an exciting electrophoresis lab. Grouped pupils analyze shark DNA to determine if it came...
Curated OER
Graphing and Analysis of Water Quality Reports
Students practice making graphs and interpreting them. They compare and contrast different sets of data. They use Microsoft Excel to create different types of graphs.
Curated OER
Designing Models to Simulate Actual Events Using a Table of Random Digits
Learners design models to simulate actual events using a tale of random digits. They estimate the likelihood of a particular outcome using results of simulation. Students investigate the uses of statistical methods to analyze data.
Curated OER
Graphing Data
Second graders examine how to make and read bar graphs. In this bar graph lesson, 2nd graders compare bar graphs to pictographs by looking at hair color survey data. They practice making a bar graph and finding the range of the data.
Curated OER
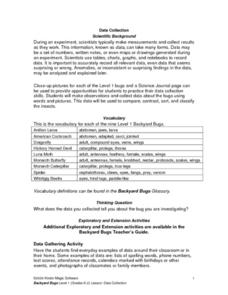
Science: Backyard Bugs Data Collection
Students practice data collection skills by observing common bugs found in their local environment. Once the data is collected they complete data sheets to compare, contrast, sort, and classify the insects. The lesson includes...
Curated OER
Thinking Systematically
Sixth graders solve real life mathematics problems. After reading a given problem, 6th graders gather and organize data into a table. They explore a pattern, and from this, derive a formula. Students solve the problems multiple ways...
Curated OER
??Discovering Patterns and Trends of the Periodic Table using PDAs??
For this lesson, 10th graders research the elements within a particular period of the periodic table of elements. Students gather data from PDA for each element and join other individuals to decpher the patterns in the peridoc table.
Curated OER
Analysis of Colonial History: Shipbuilding in Nova Scotia, 1861
Eighth graders use a web-site to examine the economic factors involving colonial ship- building. In this shipbuilding lesson, 8th graders will build a set of tables that demonstrate how they have chosen to analyze cost, processing and...
Curated OER
Periodic Table Lesson Plan
Students describe how elements are arranged on the periodic table. They compare metals, nonmetals, and metalloids based on their properties and on their locations in the periodic table. Students describe the differences between a...
Curated OER
Barrier Islands
Third graders explore how barrier islands work. In this erosion lesson, 3rd graders create barrier islands in stream tables and simulate wave action to see how it affects their island.
Curated OER
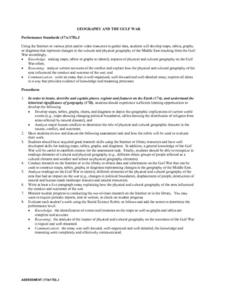
Geography And The Gulf War
Young scholars develop maps, tables, graphs, charts, and diagrams to depict the geographic implications of current world events, and analyze major human conflicts to determine the role of physical and cultural geographic features in the...
Curated OER
Making Sounds
Students perform three experiments to gain understanding of how pitch changes. In this sound lesson, students create a variety of sounds with different pitches. Students will record their data as the observe the differences in the sounds...
Curated OER
Mine Shaft Grade 8 Slope
Eighth graders investigate slopes using real life scenario. In this algebra lesson plan, 8th graders model and interpret real life data. They plot their data in a coordinate plane and discuss the results with the class.
Curated OER
Patterns and Functions
Learners investigate properties of perimeter and area. In this middle school mathematics lesson, students explore patterns in a problem solving context. Learners model and solve problems using various representations for the data as they...
Curated OER
FOLLOW THAT WATER
Students build simple stream tables and vary the angle of the stream tables in order to simulate different flow rates and compare the results. They observe various features formed in a stream table by flowing water and compare these to...
Curated OER
It'll Go With the Flow...
Students construct a water table elevation contour map and consider the direction and rate of groundwater flow to predict the actual runoff pattern. They discuss their findings and evaluate a hypothetical landfill site based on data...
Curated OER
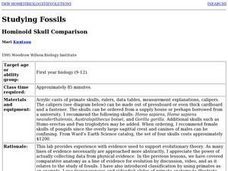
Studying Fossils: Hominoid Skull Comparison
Students collect data on the differences in Hominid skulls using acrylic casts of fossil skulls. They measure a series of structures on skulls from six different species then use the data to determine evolutionary relationships between...
Other popular searches
- Data Tables
- Data Displays
- Displaying Data
- Create Data Table
- Data Table and Graph
- Creating Data Tables
- Science Data Tables
- Creating a Data Table
- Making Data Tables
- Organizing Data in Tables
- Solar System Data Table
- Data Tables and Graphing


