Curated OER
The Apple Orchard Problem
Students explore various approaches to solving a problem of maximizing the total production of apples in an orchard. In this apple orchard lesson, students collect data in order to solve the apple orchard problem presented. Students plot...
Curated OER
Give Me Some Sugar, Honey!
Students research the history of honey and different products that come from honey. In this bees and honey activity, students review how honey is made, discuss ways people use honey, research the history of honey and its uses, create a...
Curated OER
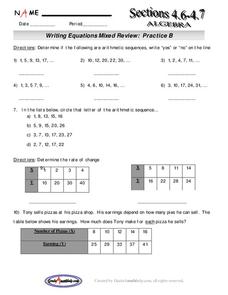
Writing Equations Mixed Review
Learners write equations based on a pattern. In this algebra lesson, students calculate the arithmetic and geometric mean of a sequence. They rewrite word problems as a linear equation and solve real life scenario based on the given data.
Curated OER
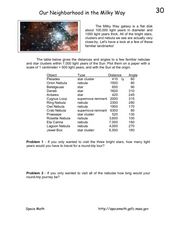
Our Neighborhood in the Milky Way
In this Milky Way galaxy worksheet, learners are given a table of distances and angles of nebulae and star clusters from the sun. Students plot each one on a piece of paper and solve 2 problems using the data.
Curated OER
TI-Nspire Activity: What Does Your Representation Tell You?
By learning to select the best representation for three meal plans, students compare three meal plans to determine the best choice. Data for the meal plans is sorted on a table, as an algebraic equation, and graphed on a coordinate grid....
Curated OER
The Motivation for Movement
Young scholars explore the geographic theme of movement. In this migration lesson, students discuss push-pull factors that motivate immigrants and interpret illegal immigration data. Young scholars also discuss the difficulties that...
Curated OER
T's Alive! Or Is It?
Learners explore data on the bone, muscle, and skin of living systems and then create a list of characteristics of these systems and relate these characteristics to bone, muscle, and skin.
Curated OER
1928 Flu
Students state the some diseases are the result of infection. They describe the risks associated with biological hazards, such as viruses. Pupils name ways that infectious disease can be prevented, controlled, or cured. Students...
Curated OER
Osmosis Investigation
Students investigate osmosis as they determine how carrot cells respond to two different environments. They conduct the experiment, record the data, and answer discussion questions.
Curated OER
Can We Be Both Conservationists and Consumers?
High schoolers explore their role as consumers and conservationists and what roles they play in today's economic climate. They explore resource allocation issues. Students analyze data and draw comparisons between historical and...
Curated OER
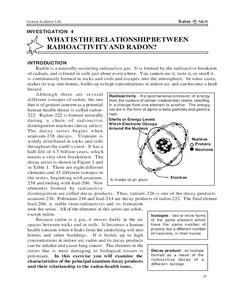
What is the Relationship Between Radioactivity and Radon?
In this radon and radioactivity worksheet, young scholars analyze the data of the isotopes of elements that occur in the decay series of uranium-238. Students answer 6 questions about the isotopes, their half-lives, their potential...
Curated OER
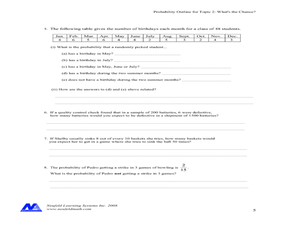
Concept: What's The Chance?
In this concept worksheet, students perform probability experiments. Using collected information, they interpret the data. Students answer questions about probability. This five-page worksheet contains approximately 15 multi-step...
Curated OER
Its OK To Be a Clod
Students describe factors that affect the solubility of a chemical substance in seawater. In this sea environment lesson, student explain how information on the solubility of a substance can be used to measure water currents. They will...
Curated OER
Water, Water Everywhere
Learners explore water. In this water absorbency instructional activity, students experiment with different items to see if they absorb water. Learners record their findings on a data sheet. Students then try making music with drinking...
Curated OER
Green Food Graph
Students explore graph making by investigating St. Patrick's day food. In this holiday food lesson, students discuss their favorite green foods in honor of St. Patrick's day. Students create a graph based on the data of which green foods...
California Academy of Science
Measuring Earthquakes
After a brief discussion on earthquakes, make a makeshift seismograph to record the shaking of the table that it sits upon. While the background information will be useful to you as a teacher, the seismograph does not seem like it would...
Curated OER
Interpreting and creating tables
Young scholars observe examples and discuss how to interpret them. They then
brainstorm examples of possible questions students could use to create a table. They take time to formulate a question and collect data.
Curated OER
Shopping Around
Third graders select a recipe and compare prices for ingredients at two different stores. They select the best place to buy the ingredients and answer questions about the process. They include their data on a spreadsheet related to their...
Curated OER
Algebra: Do You See What I See?
Students discover how to find the mean, median, and mode from sets of data. By using statistical techniques such as whisker plots and bar graphs, they display the data gleaned from problems. Individually, students complete projects...
Curated OER
"In/Out Tables of Potential Crop Loss from Defoliation
In this economics worksheet, 4th graders use the data to determine the effects of crop loss due to defoliation from the effects of hail at different stages of growth.
National Security Agency
Are You Ready to Call the Guinness Book of Records?
Learners design questions that can be answered by collecting data. In this line-plot lesson, pupils collect data and graph on a line plot on world records. An abundant supply of teacher support is provided in this resource.
Curated OER
Making Money and Spreading the Flu!
Paper folding, flu spreading in a school, bacteria growth, and continuously compounded interest all provide excellent models to study exponential functions. This is a comprehensive resource that looks at many different aspects of these...
Science 4 Inquiry
Edible Plate Tectonics
Many people think they can't observe plate tectonics, but thanks to GPS, we know that Australia moves at a rate of 2.7 inches per year, North America at 1 inches per year, and the Pacific plate at more than 3 inches per year! Scholars...
Oregon State
Using Paper Chromatography
Through the analysis of paper chromatography to separate ink from the pen found at the crime scene, learners analyze the different stains and through calculations determine the thief.
Other popular searches
- Data Tables
- Data Displays
- Displaying Data
- Create Data Table
- Data Table and Graph
- Creating Data Tables
- Science Data Tables
- Creating a Data Table
- Making Data Tables
- Organizing Data in Tables
- Solar System Data Table
- Data Tables and Graphing


