Curated OER
Chemical Reaction of Carbonate Rocks and Acids
Students complete an investigation into the chemical reaction that occurs between carbonate rocks and acids. Working in groups, students design and conduct their investigation. They create a data table detailing their results. Results...
Curated OER
Yaba "Data" Cereal
Fifth graders create and modify a database using information from cereal labels.
Curated OER
Handling Data: Comparing Distributions
Young scholars gather information by analyzing graphs, diagrams and pie charts. In this graphs and diagrams lesson, students complete addition and subtraction problems. Young scholars discuss a pie chart. Students use information to...
Curated OER
Handling Data: Probability
Fourth graders find and justify probabilities and approximations. In this repeating experiment, 4th graders complete a worksheet after rolling die and tossing coins to determine outcomes.
Serendip
Is Yeast Alive?
Through two investigations, life science learners determine whether or not yeast is alive. They perform tests for metabolism by providing sugar and observing if gas is produced as a byproduct. They incubate some of the sample for at...
Virginia Department of Education
Average Atomic Masses
Facilitate learning by using small objects to teach the principles of atomic mass in your science class. Pupils determine the average mass of varying beans as they perform a series of competitive experiments. They gather data and...
Curated OER
Latitude
Your young geologists generate a graph given a table of values from the context of latitude and percent of the earth's surface north of that latitude. The questions in the activity then focus the learners to a deeper understanding of the...
Curated OER
Graphs Galore
Fourth graders conduct surveys to collect data. They analyze and interpret the data, then determine which type of graph is appropriate for the data. Students use the data to make predictions, discover patterns and draw conclusions...
Curated OER
Human Activity and the Environment
Students review and analyze graphs and tables as a group. They develop their graph and data analysis skills by converting data tables from Human Activity and the Environment into graphs.
Curated OER
Get a Half Life!
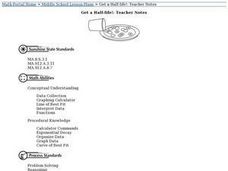
Eighth graders use M&M's to experiment with data. They use a graphing calculator to determine the best equation for their data; linear, quadratic or exponential. They analyze the data to find the half-life of their M&M's.
Curated OER
How does Your Province Stack Up?
Students investigate data about age, and sex of a population. In this statistics lesson, students are given data on a population to analyze and compare to other provinces. This assignment is part of a geography lesson and requires 3...
Curated OER
Get a Half-life!
Students use m&m candies as their sample set. They begin by counting the total number of candies to determine their sample size. Students put the candies into a cup and shake them gently before pouring them onto a paper plate. Count...
Curated OER
Comparison of Snow Cover on Different Continents
Students use the Live Access Server (LAS) to form maps and a numerical text file of snow cover for each continent on a particular date. They analyze the data for each map and corresponding text file to determine an estimate of snow cover...
Curated OER
Strings and Springs
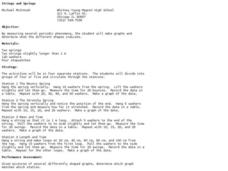
Ninth graders explore physics with springs and strings. In this force and motion lesson, 9th graders rotate through four stations exploring how various springs stretch and bounce, and how mass and length affect a pendulum's swing. They...
Curated OER
Graphing Made Easy
Fourth graders discover the appropriate way to construct and analyze bar, line, picto, and circle graphs. They set up frequency tables and perform some statistical analysis (mean, median, and mode) on their data.
Curated OER
Histograms and Statistical Graphics
In this statistics worksheet, students solve 6 data problems. They construct a histogram of given data, they create a frequency polygon, and a stem and leaf diagram. Students create a dot plot and a pie chart for given data sets. On the...
NOAA
What's the Difference?
Due to the isolation of seamounts, their biodiversity offers a great deal of information on the development of biological and physical processes. Pupils use simple cluster analysis to rate the similarity and differences in biological...
EngageNY
Substituting to Evaluate Addition and Subtraction Expressions
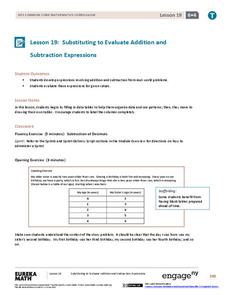
Substitute this resource for what you used to use. Learners identify patterns in data tables and write addition and subtraction expressions to represent relationships. Substitution allows them to solve problems in context in the 20th...
Curated OER
Math: Will The Airplane Get Off the Ground?
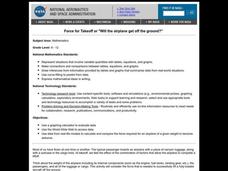
Students use data from real-life models to calculate and compare the force required for an airplane of a given weight to become airborne. They use a graphing calculator to evaluate data and use the World Wide Web to access data.
Curated OER
From Probability to Combinatorics and Number Theory
Students see how division is used to help solve probability problems. They use tables as data structures where they are used to count outcomes and to compute probabilities. Students use games to help solve probability problems.
Curated OER
Are Taxes "Normal?"
Students explore the concept of normal distribution. In this normal distribution lesson plan, students find the normal distribution of taxes in the 50 US states. Students make histograms, frequency tables, and find the mean and median of...
Curated OER
Box Plots
Students review the concept of median, explore how to calculate quartiles for any size data set and experience how to build a box plot.
Curated OER
Sustainable Development and Canada's Natural Resources
Students use text information, data and graphs to explain what sustainable development is, and to investigate the rate of consumption of Canada's natural resources. In groups, they graph their findings.
Curated OER
Party, Party, Party
Second graders conduct investigations with counting, comparing, organizing, analyzing, displaying and interpreting data. They pose questions for investigation and collect the data. Students display the data in tally charts, uniform...
Other popular searches
- Data Tables
- Data Displays
- Displaying Data
- Create Data Table
- Data Table and Graph
- Creating Data Tables
- Science Data Tables
- Creating a Data Table
- Making Data Tables
- Organizing Data in Tables
- Solar System Data Table
- Data Tables and Graphing


