Statistics Education Web
NFL Quarterback Salaries
Use statistics to decide if NFL quarterbacks earn their salaries! Learners study correlation coefficients after using technology to calculate regression equations. Through the data, they learn the meaning of correlation and correlation...
Curated OER
Graphing Worksheet: Favorite Sports
In this graphing worksheet, students analyze a bar graph in which favorite sports are displayed. Students answer 8 questions about the graph. Note: The bars in the graph are shaded in different colors.
Teach Engineering
Energy on a Roller Coaster
Roll with your class into the idea of conservation of energy. Pupils use a roller coaster track to collect data to reinforce the concept of conservation of energy and the influence of friction. Class members then create a graph from...
Curated OER
Which Fish Where?
Here is a lesson outline that prompts elementary learners to graph and analyze data regarding fish caught along the Hudson River. They will review vocabulary and complete 2 worksheets which can be accessed by clicking on the provided links.
Curated OER
Finding Equations
Students make equations from everyday data. They create a graph from the equations. Students predict and analyze the results. Students complete the second scenario on their own and turn in their handout.
Curated OER
The Race of Baseball All-Stars
Collect and analyze data. Pupils graph their data and model with it to solve real life problems. They use logic and deductive reasoning to draw conclusions.
National Museum of Nuclear Science & History
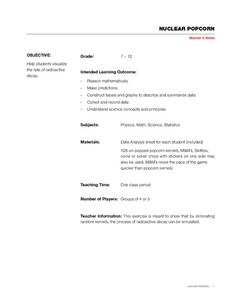
Nuclear Popcorn
Make your lesson on radioactive decay pop with this lab exercise. Using popcorn kernels spread over a tabletop, participants pick up all of those that point toward the back of the room, that is, those that represent decayed atoms. As the...
Curated OER
Graphing
Students collect data to create different types of graphs-line, pie, and bar graphs. They use StarOffice 6.0 to create graphs.
Alabama Learning Exchange
Keep It Movin'!
Learners conduct an experiment to study friction. They complete a KWL chart on friction and conduct an activity about the amount of friction on a moving object. To conclude, pupils create a table or graph of the data collected and they...
Curated OER
Meatiest States: Graph Problem Solving
For this graph problem solving worksheet, learners analyze a graph that shows commercial red meat production in five states. Students answer 5 word problems using the data on the graph.
Curated OER
Beginning Modeling for Linear and Quadratic Data
Students create models to represent both linear and quadratic equations. In this algebra lesson, students collect data from the real world and analyze it. They graph and differentiate between the two types.
Curated OER
Walking on Air
Pupils collect and analyze data with a graph. In this statistics instructional activity, students use central tendencies to find the meaning of their data. They display the data on a Ti calculator.
Curated OER
Data Analysis
In this data analysis worksheet, pupils solve and complete 4 different types of problems. First, they reduce the data provided to find the means, and graph the means in a line graph. Then, students graph the data from each mixture shown...
Curated OER
Data Analysis Digital Display
Students create a survey online. In this math lesson, students graph survey data using flisti.com. They share and analyze their classmates' histogram.
Curated OER
Organizing and Interpreting Data
In this organizing and interpreting data activity, learners solve and complete 10 different problems related to reading various data tables. First, they complete the 3 charts shown with the correct tally amount, frequency amount, and...
Curated OER
Using Graphs and Charts
Students complete T charts and manipulate numbers using graphs and charts. In this math graphs and charts lesson, students review the concepts of pattern and function. Students then complete practice pages where they manipulate numbers...
Curated OER
Use a Graph Reteach 4.8
For this graph worksheet, students solve 3 problems using a data table and bar graph. Students write number sentences to figure out answers to the questions about kinds of toys in a shop.
Curated OER
Graph: Number of Laysan Albatross Nests and Chicks at Kilauea Point
In this bar graph worksheet, students solve and complete 2 problems related to reading a bar graph. First, they use the data table found at the bottom of the sheet to complete the bar graph which illustrates the number of nests and...
Curated OER
Survey Says...
Young learners create and implement a school-wide survey about student body favorites! Learners record and analyze the data on a bar graph, picture graph, and line graph, and then display the data. Then, wrap it all up with a celebration...
Curated OER
Statistics of Mars
Students explore the concept of central tendencies. In this central tendencies lesson, students sort M&M's or Skittles based on color. Students graph their results. Students find the mean, median, and mode of their data.
Living Rainforest
Finding the Rainforests
From Brazil to Indonesia, young scientists investigate the geography and climate of the world's tropical rain forests with this collection of worksheets.
Curated OER
Surname Survey
Students use data from the U.S. Census Bureau to determine whether last names in a local phone directory reflect the Census Bureau's list of the most common surnames in the country. In this surnames lesson plan, students use the Internet...
Curated OER
Measures of Center
In this statistics worksheet, students find mean, median, and mode for 3 problems. They find the mean of summarized data in 2 problems.
Curated OER
Favorite Food
Students are given three choices of food. They then decide on their favorite and predict what the class's favorite food will be. After the teacher enters the data into the computer, students gather around the computer to view the...
Other popular searches
- Data Tables and Graphing
- Graphs and Data Tables
- Create Data Tables From Graphs
- Data Displays and Graphs
- Data Reading Graph Table


