Curated OER
Solar Kit Lesson #7 - Positioning Solar Panels I: Explorations with Tracking
In this first part of a two-part lesson, learners track and record the sun's azimuth using a solar panel. They graph and analyze the data to identify relationships among the time of day, the altitude and azimuth of the sun, and the...
Curated OER
Year 5, Term 2, Unit 9 - Day 1
A well-designed presentation can help your class with a variety of mathematical concepts. Pupils practice many different computational skills, such as addition, subtraction, finding multiples of 10, working with decimals, and solving...
Inside Mathematics
Scatter Diagram
It is positive that how one performs on the first test relates to their performance on the second test. The three-question assessment has class members read and analyze a scatter plot of test scores. They must determine whether...
Curated OER
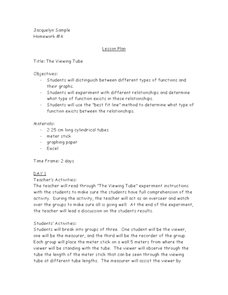
The Viewing Tube
Looking for an excellent lesson that incorporates math, science, and technology? Groups of three students use a viewing tube to perform an experiment, and discover how to organize their data into an Excel spreadsheet. This is a very...
Curated OER
A Closer look at Oil and Energy Consumption
Upper graders analyze basic concepts about the consumption, importation and exportation of the worlds oil production. They create several graphs to organize the data and draw conclusions about the overall use of oil in the world.
Curated OER
TE Activity: A Tornado in My State?
Students study data about tornadoes in the United States while completing a worksheet. They develop a bar graph showing the number of tornadoes for the top ten states in the US. They find the median and mode of the data set.
Curated OER
Foxes and Rabbits 3
Use realistic data to find trigonometric models that best fit the populations of foxes and rabbits in a national park. Included are detailed explanations of the answers and process. This is a follow-up exercise to the lesson listed in...
Curated OER
Cosmic Chemistry: An Elemental Question
Space scientists investigate the cosmic phenomena in order to search for answers to possible origins of the solar system. They consider the concepts of elements and isotopes. Data is analyzed looking at tje abundance of elements...
Miami University
Chapter Nine Worksheet: Monopoly
Advanced economics pupils analyze a series of graphs, data sets, and profit scenarios all related to monopolies and marginal revenue. They read through the background information, complete a graph using the data provided, and justify...
Curated OER
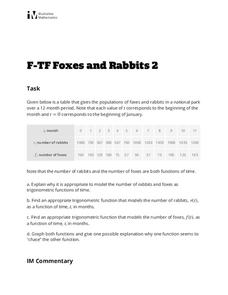
Foxes and Rabbits 2
Explore the relationship between the population of foxes and rabbits in a national park using trigonometric models. Plot data and find the appropriate trigonometric functions. Two questions require interpretation and explanation of...
Illustrative Mathematics
Average Cost
Here is an activity that presents a good example of a function modeling a relationship between two quantities. John is making DVDs of his friend's favorite shows and needs to know how much to charge his friend to cover the cost of making...
Curated OER
Pen Pals
Students collect bird count data at their sites, and share and compare the data collected from two different schoolyards using computer technology.
Curated OER
Wetland vs. Stream Macroinvertebrates
A link to a comprehensive macroinvertebrate guide gives you the information needed to prepare for this field study activity. Sample macroinvertebrates are collected from areas representing different environmental conditions. Junior...
Curated OER
# 21 Measuring Nitrate by Cadmium Reduction
Students design an experiment to evaluate the effects of various treatments on the nitrogen cycle in a freshwater aquarium. They are required to maintain a laboratory notebook of all work, measure the key analytes of the biosystem at...
Curated OER
Taking Its Toll
Young scholars explore ratios. For this rates lesson plan, students create a ratio to compare the price of a toll to the distance travelled. They compute the average cost per mile, determine the slope between two ordered pairs, and make...
Curated OER
A Research Project and Article For the Natural Inquirer
Get your class to use the scientific process to solve a scientific problem. They utilize the Natural Inquirer magazine to identify a research question which they write an introduction to and collect data to answer. They use graphs,...
Curated OER
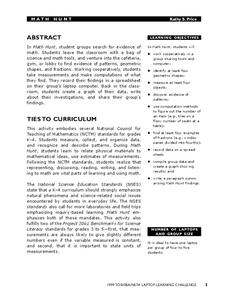
Math Hunt
Go on a scavenger hunt around your school to find evidence of math. Investigate different areas of your school for patterns, fractions, and different geometric shapes. Finally, create a spreadsheet and plot the data you've collected.
02 x 02 Worksheets
Inverse Variation
Discover an inverse variation pattern. A simple lesson plan design allows learners to explore a nonlinear pattern. Scholars analyze a distance, speed, and time relationship through tables and graphs. Eventually, they write an equation to...
Howard Hughes Medical Institute
Patterns in the Distribution of Lactase Persistence
We all drink milk as babies, so why can't we all drink it as adults? Examine the trend in lactase production on the world-wide scale as science scholars analyze and interpret data. Groups create pie charts from the data, place them on a...
Curated OER
Discovering Pi
Define terminology related to a circle. Practice accuracy in measuring and then create a spreadsheet based on data collected from solving for parts of a circle. Groups can have fun analyzing their data as it relates to Pi.
It's About Time
Volcanic Hazards: Airborne Debris
Pupils interpret maps and graph data related to volcanic ash. Then they analyze the importance of wind speed and the dangers of the ash to both life, air temperature, and technology.
It's About Time
Newton's Law of Universal Gravitation
While science is looking for correct explanations, pseudoscience often fills in the blanks. Pupils explore the relationship between light distance and intensity and graph their data. Then they compare their data to Newton's Law of...
Shmoop
ELA.CCSS.ELA-Literacy.SL.9-10.2
What are diverse media formats? Have your class figure this out on their own through small-group brainstorming. The resource includes two related activities about different kinds of data that will help your class get a grasp of media...
Howard County Schools
Planning for Prom
Make the most of your prom—with math! Pupils write and use a quadratic model to determine the optimal price of prom tickets. After determining the costs associated with the event, learners use a graph to analyze the break even point(s).
Other popular searches
- Data Tables and Graphing
- Graphs and Data Tables
- Create Data Tables From Graphs
- Data Displays and Graphs
- Data Reading Graph Table


