Curated OER
Monitoring Oxygen Level
Students measure oxygen percentages in room air and air exhaled after they perform various activities. They explore various websites, and record and analyze the data from the experiments.
Curated OER
Plotting Wind Speed and Altitude
Students construct, read and interpret tables, charts and graphs. They draw inferences and develop convincing arguments that are based on data analysis. They create a graph displaying altitude versus wind speed.
Curated OER
How Do Clouds Affect Radiative Energy
Learners graph the upwelling and downwelling of shortwave radiation. They create a data table with the information. Students compute the Watts per square meter. They discuss their results and whether or not cloud type affects daily...
Curated OER
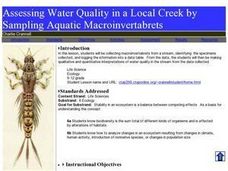
Assessing Water Quality in a Local Creek by Sampling Aquatic Macroinvertabrets
Learners experiment collecting macroinvertebrates from a stream and identify the specimens collected and then log in the information into a data table. From the data, they make qualitative and quantitative interpretations of water quality.
Curated OER
Successful Resource-based Learning Strategies for the Geography of Canada Course
Students conduct a statistical research project on population changes. They evaluate demographic issues, such as the size and location of native people. immigrant groups, and the age and gender of the population.
Curated OER
Statistically Lyrical
High schoolers examine and discuss the writing of ratios as fractions and where they can be found in the real world. They complete worksheets and a questionnaire, and calculate the mean, median, and mode scores for the class.
Curated OER
Finding the Percent of a Number in Fish Body Weight
Students use fractions to find the weight of fish. They use percentages to determine the correct amount to feed them. They organize their data into a graph and shares with the class.
Curated OER
Comparing Pulse Rates
Young scholars participate in a lab that demonstrate one example of how the human body maintains homeostasis. Students collect data from themselves and observe how their own bodies react to exercise.
Curated OER
Does The Type of Mulch Used Affect Plant Growth?
Students measure, record and graph the plants they grow in a controlled setting. They feed and water the plants as needed and use the scientific method to evaluate the growth.
Curated OER
How Long Can You Go?
Eighth graders examine the usefulness of a line of best fit by collecting and graphing data, using a graphing calculator to determine the line of best fit, and making a variety of predictions. They watch a video, then design a...
EngageNY
Informally Fitting a Line
Discover how trend lines can be useful in understanding relationships between variables with a lesson that covers how to informally fit a trend line to model a relationship given in a scatter plot. Scholars use the trend line to make...
Curated OER
Tracking the Salt Front
Using the Hudson River as the focus, learners discuss the difference between salt water and fresh water environments, analyze maps and graphs, and complete addition and subtraction problems. This activity comes with a wealth of...
EngageNY
Scatter Plots
Scholars learn to create scatter plots and investigate any relationships that exists between the variables with a lesson that also show them that statistical relationships do not necessarily indicate a cause-and-effect relationship.
Natinal Math + Science Initative
Slope Investigation
Context is the key to understanding slope. A real-world application of slope uses a weight loss scenario with a constant rate of change to introduce the concept of slope of a line, before it makes a connection to the ordered pairs and...
SRI International
The Water Crisis
Water, water, everywhere, right? Wrong. Learners assess their own knowledge of water availability on Earth. Then, through a reading, a teacher-led presentation, and an activity, pupils learn about the importance of available clean...
Wild BC
The Greenhouse Effect: Warming the Earth Experiment
First in a two-part lesson on the greenhouse effect, this lesson involves a classroom demonstration of the phenomenon, and a lab group experiment with color and absorption. Although there are easier ways to demonstrate the greenhouse...
Virginia Department of Education
How Much is that Tune?
Tune in for savings! Scholars investigate pricing schemes for two different online music download sites. After comparing the two, they determine the numbers of songs for which each site would be cheaper.
Curated OER
Line 'Em Up!
Students find coordinate points on a grid and create a line graph with those points. This lesson should ideally be used during a unit on various types of graphs. They make and use coordinate systems to specify locations and to describe...
Curated OER
Ice Cream Pictograph
Students create a graph. In this pictograph lesson plan, students cut out 20 small ice cream cones and decorate them. Students create a pictograph with their ice cream cones.
Curated OER
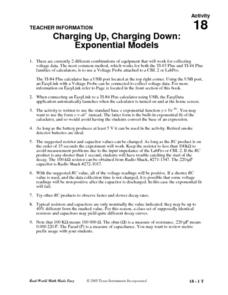
Charging Up, Charging Down
Learners collect and analyze voltage data. Then, they investigate exponential functions using the TI and a Voltage Probe and graph their data and analyze it using a table.
Curated OER
Lessen the Loan
Middle-schoolers explore the concept linear equations. They use the internet to navigate through videos and problems. Pupils problem solve to determine rates of change, slope, and x and y-intercepts.
Curated OER
Measuring the Speed of a Wave
Students create an experiment in which they measure the speed of a wave and record the data in a graph. They work in small groups to write the procedure for the experiment and share it with another group for cross checking of the...
Curated OER
The Ghost of Populations Past
Students study population distribution and survivorship curves by collecting data regarding age of death of humans from either tombstones, newspapers, or other community resources. Students analyze data by creating graphs and population...
Curated OER
Creating Bar Graph
Seventh graders, after an explanation and demonstration compare how many different places there at Cocowalk.
Other popular searches
- Data Tables and Graphing
- Graphs and Data Tables
- Create Data Tables From Graphs
- Data Displays and Graphs
- Data Reading Graph Table


