Curated OER
Cost of living
High schoolers explore the cost of living differences within Europe by interrogating data within tables and graphs. They investigate personal incomes, earnings of selected occupations, monthly earnings and incomes by education.
Curated OER
Creating a Bar Graph with a Graphing Program
Students use the S'COOL data base to create a bar graph.
Howard County Schools
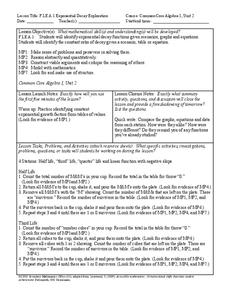
Exponential Decay Exploration
How can you model exponential decay? Explore different situations involving exponential decay functions and decreasing linear functions by performing activities with MandM candy, popcorn kernels, and number cubes.
Illustrative Mathematics
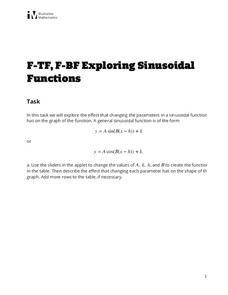
Exploring Sinusoidal Functions
What effect does changing a parameter have on the graph of a trigonometric function? Pupils use a Desmos applet to explore the general sine graph. They experiment changing different parameters and record the resulting change of the...
Curated OER
Domain and Range
Relations, and functions, and line tests, oh my! An instructional slideshow demonstrates the definitions of a relation, a function, and the domain and range of a relation. Viewers then learn how to use mappings and vertical line tests to...
Curated OER
Word Problem Practice Workbook
Need worksheets that challenge your middle schoolers to apply their understanding of math? Problem solved! From integers, fractions, and percents, to algebra, geometry, and probability, over 100 pages of word problem worksheets are...
Curated OER
The Winner Is...
Students create graph from previously collected data using "The Graph Club."
Savvas Learning
Saxon Math 5/4
You'll never have to search for another worksheet again after downloading this extensive collection of Saxon math materials. With over 600 pages of example problems and skills practice exercises, this is a must-have resource for any...
Curated OER
Endangered Species
Ninth graders graph data in order to compare the number of extinct species and a rise in human population. They analyze the data collected. Students are encouraged to infer the relationship.
Curated OER
Heartbeat Project
High schoolers enter information about their heartbeats into a spreadsheet. They construct data displays and calculate statistics. They describe and justify their conclusions from the data collected.
Curated OER
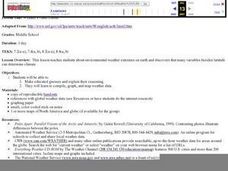
Weather's Outer Limits
Students make educated guesses and explain their reasoning and compile, graph, and map weather data. They then study environmental weather extremes on earth and discover that many variables determine climate.
Curated OER
Algebra 1
Students study the functional relationships of a variety of problems. In this functional relationship lesson, students determine the dependent and independent quantities of a given set of data. Students record the data and write it in...
Curated OER
How's The Weather?
Students make a box and whiskers plot using the TI-73 graphing calculator. Each student would have their own calculator but they would work in small groups of two or three to help each other enter the data and make the plots.
Curated OER
Probability: The Study of Chance
Students conduct an experiment, determine if a game is fair, and collect data. They interpret data, then display line graph. They conduct analysis of game for probability.
Curated OER
How Alike Are We?
Fourth graders find the range, mode, median, and mean for each of the data sets (height and shoe size). They discuss which measure of central tendency for each data set best represents the class and why. Students graph the shoe size and...
Curated OER
Weather Lesson
Learners discuss the weather conditions. They read thermometer, rain gauge, barometer, and wind direction and speed. They record observations of weather conditions and enter information into data base on the computer.
Curated OER
Sundials and Shadows - What Can They Teach Us About Seasons?
Pupils collect and analyze data relating to seasonal changes. They view a video, research web sites and build a sundial to collect their data.
Curated OER
Investigation-How Many Toothpicks?
Seventh graders use toothpicks to investigate a series of designs and identify patterns. Data is organized and analyzed using tables and graphs, and students make generalizations using algebraic expressions.
Curated OER
Fun with Math using Magnetic Force
Sixth graders explore and discuss the effectiveness of magnets in different situations. In this math lesson, 6th graders discuss rate and graphs after exploring with magnets using different restrictions on the magnets. They analyze their...
Curated OER
Where Are the Bugs?
Students trap, collect and identify arthropods in a newly created desert tortoise preserve area over a period of one school year. They determine the rate at which various arthropods take up residence in the newly landscaped area. Data is...
Curated OER
Old Glory
Learners utilize mathematical concepts such as: measurement, ratio and proportion and geometric probability to analyze the components of the U.S. Flag. They collect, organize and interpret data by constructing charts, tables and graphs...
Curated OER
Plugging Into The Best Price
Examine data and graph solutions on a coordinate plane with this algebra lesson. Young problem-solvers identify the effect of the slope on the steepness of the line. They use the TI to graph and analyze linear equations.
Illustrative Mathematics
Do You Fit In This Car?
A short activity that focuses on the normal distribution as a model for data distribution. Using given means and standard deviations, your budding statisticians can use statistical tables, calculators, or other statistical software to...
Curated OER
Breakfast Cereal - How Nutritious Is Yours?
Students analyze the nutritional value of breakfast cereal in order to make an informed choice. They create a stem and leaf plot which analyzes the nutritional value of the cereal they eat on a regular basis. Students write a letter to...
Other popular searches
- Data Tables and Graphing
- Graphs and Data Tables
- Create Data Tables From Graphs
- Data Displays and Graphs
- Data Reading Graph Table


