Curated OER
The Coyote Population: Kansas Prairies
Students discover animal lifestyles by researching their ecosystem. In this animal statistics lesson, students research the geography of Kansas and discuss the reasons why wild animals survive in the open Kansas fields. Students complete...
Curated OER
Team Apollo
Seventh graders brainstorm about problems with a school track. They research different possibilities for a solution. They test different track materials with erosion, durability, abrasiveness and resiliency. They determine the area,...
Curated OER
Great Tasting Shapes
Fifth graders investigate the concept of median, mode, and range using a simple model for display purposes. They examine different shaped crackers out of a box and identify the ones that occur the most. Then the calculations for the...
Curated OER
Rate of Solution
Eighth graders determine the amount of agitation necessary to dissolve various sized sugar particles. This task assess students' abilities to collect, organize, and interpret data, create appropriate graphs, predict future events based...
Curated OER
Survey Project
Eighth graders create a website using FrontPage. They use inserted forms to collect survey information and use Microsoft Excel and MS Word to create a presentation of the survey and the results.
Curated OER
Is It There?
Students participate in a lesson designed to illustrate these concepts using simple materials. They use Science process skills to observe, measure, predict, make inferences, and communicate while completing the activity. Proper safety...
Curated OER
M&M Statistics
Pupils determine the difference between guessing and making a prediction. They discuss what they could graph using a bag of M&M's. They take a Raw data sample and convert it into a sample. They graph the actual results and combine...
Curated OER
Numeracy Practice- Going Out For Lunch
In this math learning exercise, learners complete the various types of activities that include graphs, data tables, and completing number sentences.
Curated OER
Working with Frequency Tables
In this Working with Frequency Tables worksheet, students analyze data that is organized in simple frequency charts. They calculate average from data presented in a frequency table, calculate a cumulative score, and identify data that...
Curated OER
Observing Fall Migrants
Students keep a detailed data collection log of the different types of monarch behavior. They track the weather conditions daily and link it to the migration of the monarchs. They summarize their data using either a graph or a computer...
Curated OER
A Day at the Beach
Student read Sheryl Wilson's story, "A Day at the Beach" while classifying items they find. They design a chart of the items before using educational graphing software to create a graph.
Curated OER
Excel temperature Graphs
Students gather data about the weather in Nome, Alaska. In this Nome Temperature lesson, students create an excel graph to explore the weather trends in Nome. Students will find the average weather and add a trend line to their graph.
Curated OER
Forces and Graphing
Students analyze graphs to determine relationships between variables and rates of change. They determine the basic concepts about static reaction forces. They determine the slope and equation of a line.
Curated OER
Using Tables
In this using tables learning exercise, 9th graders solve and complete 10 various types of problems that include using tables to determine information. First, they write an equation to determine the total amount. Then, students define...
Curated OER
Frequency Tables
Seventh graders construct frequency tables and box-and-whisker plots. After constructing tables and plots, they take a quiz on mean, median, mode, range, scientific notation, and number properties.
Curated OER
Coloring Interval Graphs
Students investigate planning an activity and getting it done on time. In this algebra lesson, students define vocabulary words related quadratic equations, including the vertex and intervals. They figure a good way to color graphs...
Curated OER
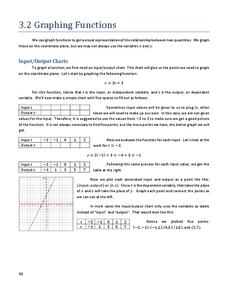
Graphing Functions
In this graphing functions instructional activity, students write functions in logarithmic and exponential forms. They evaluate logarithms and determine the inverse of a function. Students graph functions. This six-page instructional...
Curated OER
Bungee M&M's
Eighth graders experiment with M&M's and a cup attached to a spring to to simulate a bungee jump. They graph the results of the experiment and make predictions for continuing the experiment. They determine the "line of best fit."
Curated OER
Closing the Case
Fifth graders collect data and prepare data displays using a survey with statistical information.
Curated OER
The M&M's Brand Chocolate Candies Counting Book
First graders use estimation skills and gather data and record their findings
Curated OER
Scientific Investigation- Magnets
Students conduct a scientific investigation to determine if a magnet attracts paper clips through different materials. Students write out their procedures, collect data and present it in a table or chart, and analyze their results.
Curated OER
Trouble in the Troposphere
Students Use data sets from MY NASA DATA to produce graphs comparing monthly and yearly ozone averages of several U.S. cities. They analyze and evaluate the data and predict trends based on the data. In addition, they discuss and...
Curated OER
The Origins and Maintenance of Earth's Atmosphere
For this atmosphere worksheet, students read over a data table showing the percentage of carbon dioxide, oxygen and nitrogen in the atmosphere over the last 4500 million years. Students create a graph comparing these gases over time and...
Curated OER
TIMS, The Bouncing Ball: Math, Science, Measurement, Graphs, Variables
Students determine the exact relationship between the height from which a ball is dropped and the distance that it rebounds.
Other popular searches
- Data Tables and Graphing
- Graphs and Data Tables
- Create Data Tables From Graphs
- Data Displays and Graphs
- Data Reading Graph Table


