Curated OER
Using 3-D Models for Code Validation with FoilSim
Students use FoilSim to complete the activity to create tables of data sets comparing the lift values for a 3-D model of a symmetrical wing section to the values predicted by the FoilSim software.
Curated OER
Heat Absorption
Students examine how heat moves from substance to another. In this heat absorption instructional activity students identify ways that heat is transferred and analyze data.
Curated OER
Fire Fighting Crew
Students use the concepts in statistics to make decisions. They calculate the mean, median and mode. They compare one firefighter against another and analyze the data. They share their information with the class.
Curated OER
Hermit Crab Races
Students predict the speeds of humans and hermit crabs and investigate their predictions using ratios and formulas. AppleWorks is used for this lesson, which includes a data worksheet.
Curated OER
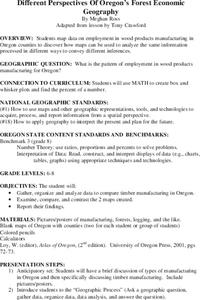
Different Perspectives of Oregon's Forest Economic Geography
Students locate the many forests located in Oregon. In groups, they use the internet to research employment data on wood products made in the state. They discuss how looking at information presented in a different way can change their...
Curated OER
Pepe Cleaners
Seventh graders gather data to determine the relationships between the base and height of rectangles with fixed perimeters and express the relationships using words and symbols. Students build rectangles with pipe cleaners. They create...
Curated OER
Mathematical Models with Applications: What's Your Rate of Change?
Students use regression methods available through technology to select the most appropriate model to describe collected data and use the model to interpret information. They use numeric techniques to write the equation of a line that...
Curated OER
Temperature Changes in the Atmosphere
Students analyze how different variables affect atmospheric temperature. They construct a model of an ecosystem, select a variable, design and conduct an experiment, and record and analyze the data to present to the class.
Curated OER
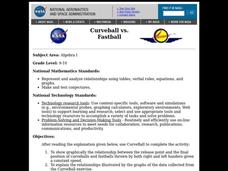
Curveball vs. Fastball
Students graph the relationship between the release point and the final position of curveballs and fastballs thrown by both right and left handers given a constant speed, and explain the relationships illustrated by the graphs of data.
Curated OER
What Does It Eat?
Students, working in research teams, investigate the eating habits of crickets. They collect and record data and compare their methods and results with other groups by making tables or graphs. They sumarize their findings with posters or...
Curated OER
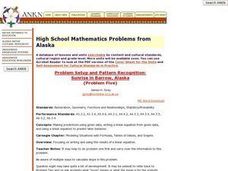
High School Mathematics Problems from Alaska: Problem Setup and Pattern Recognition: Sunrise in Barrow, Alaska
Young scholars make predictions using given data, writing a linear equation from given data, and using a linear equation to predict later behavior.
Curated OER
Firewood Problem
Students write and solve their own story problems. They determine the cost of firewood by the cord. They organize their data in graphs and charts.
Curated OER
Mother May I?
Third graders measure distance using nonstandard units of measure. In this measurement lesson, 3rd graders measure a given distance through the use of the game "Mother May I?" Student gather and compare data on how many "giant steps" and...
Curated OER
Tracking Weather Over Time
Students gather, analyze and interpret data. They explain scientific inquiry. They plot points on a map and report information from a spatial perspective.
Curated OER
Groundwater Pump Test
Students observe groundwater flowing to a pump, changes in groundwater table as a result of pumping, and the quantity and quality of water in the groundwater system. Students must graph and interpret their data, and quantify orders of...
Curated OER
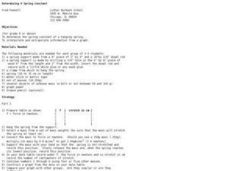
Determining A Spring Constant
Students determine a spring constant and extrapolate information from a graph. In this spring lesson plan students divide into groups and complete a lab activity.
Curated OER
Energy Choices
Students add and multiply decimals to complete gas choice worksheets. They discover which gas supplier has the best gas prices. Students collect and interpret data about local natural gas suppliers and use this information...
Curated OER
What is the Problem of Boston Harbor?
Pupils recognize the affects of technology on the environment. They examine data to determine methods to improve waater quality. A research paper is written to desribe recommendations for improving water in the future.
Curated OER
Ya' Gotta Have Heart
Fourth graders study the parts of the human circulatory system and how they function. They design a flow chart of the circulatory system and use data to construct charts and graphs.
Curated OER
Budgeting 101
Students identify various sources of income and discern between needs and wants as they also learn to create a personal budget. In this personal budget lesson, student understand financial scenarios as they relate to different ways...
Curated OER
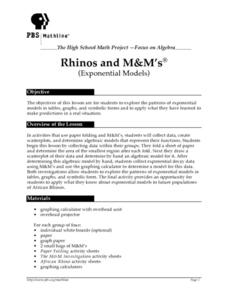
Rhinos and M&M's
Students analyze patterns of exponential models by collecting data in paper folding and M&M investigations. They use graphing calculators to create scatter plots that lead to equations for the exponential models. They then apply this...
Curated OER
Giant Mystery
Third graders determine the relationship between hand size and body size using centimeters as the unit of measure, They use the relationship to find the size of a hypothetical giant. They graph the measurements using a spreadsheet program.
Curated OER
Conducting a Scientific Investigation
Students investigate a possible health problem in the local school district through inquiry into attendance records, activities, maps, graphs, and data tables. The simulation continues as solutions for the problem are sought.
Curated OER
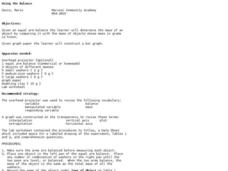
Using the Balance
Students determine the mass of various objects. In this integrated math and science lesson, students use an arm balance to compare a known object to a combination of washers with a fixed weight. Students record data, construct a bar...
Other popular searches
- Data Tables and Graphing
- Graphs and Data Tables
- Create Data Tables From Graphs
- Data Displays and Graphs
- Data Reading Graph Table


