Curated OER
Comparing Linear and Exponential Functions
Teach your class how to differentiate between linear and exponential functions. They use exponential properties to solve problems, graph them using the TI-Navigator, and make comparisons.
Curated OER
Charting Historical Gas Prices
Learners investigate the historical and current prices of a gallon of gasoline. Using an online tool, they calculate the inflation-adjusted cost of gasoline over the years, and create a graph to demonstrate the actual cost vs. the...
Curated OER
Do the Elephants Need Sunscreen? A Study of the Weather Patterns in Etosha
Learners analyze the weather patterns in Namibia. They create a graph of the yearly temperatures and use the internet to gather information. They discuss how the weather goes in cycles in the area.
Curated OER
Poetic Math Greeting Cards
Fourth graders work in groups; collect data in a survey; depict in tables, charts, or graphs the results of the survey; and make predictions. They use creative writing skills and computer skills to generate a greeting card of their own.
Curated OER
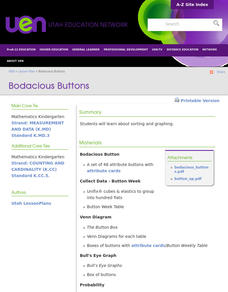
Bodacious Buttons
First graders participate in games, graphing, and probability exercises to sort and graph buttons. They sort buttons with Venn diagrams and Bull's Eye graphs.
Curated OER
Getting Out of Line
Young scholars explore basic connections between graphs, tables, and symbolic representations for lines, parabolas, inverse models, and exponential models. One of the primary goals of this lesson plan is to help students begin to...
Curated OER
Domino Dash
In this speed worksheet, students use dominoes to measure the average speed of rows falling over. Students make a line graph to show the relationship between the length of the domino row and the time. Students answer 8 questions about...
Curated OER
Jelly Bean's Galore
Young scholars investigate the origins of the Jelly Bean. They complete a Scavenger Hunt using the jellybean website. Pupils create a bar graph using information collected about jelly beans. Students discuss the time of year that Jelly...
Curated OER
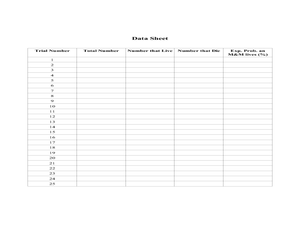
RIP M&M's
Students solve theoretical probability problems. In this algebra lesson, students apply the concept of probabilities to solving real life scenarios. They collect data and graph it using experimental probability.
Curated OER
Equations Lesson Plan
Seventh graders play "What's my Rule" beginning with simple equations and working towards harder problems as student's gain confidence. They evaluate the equations by graphing them. Students identify the slope and y intercepts of the...
Curated OER
Spaghetti Bridges: Student Worksheet
In this math worksheet, students will create a "bridge" out of spaghetti and test it's strength with pennies. Students will record their results on a table and then graph the results.
Curated OER
The Solar System
High schoolers construct a sketch of the planets in our solar system using concentric circles and angles. In this solar system lesson plan, students plot the position of each planet on concentric circles using graph paper. The sun is...
Curated OER
Deer: Predation or Starvation
In this predation or starvation worksheet, learners read about the effects of the wildlife service bringing in predators (wolves) to control a deer population. Students calculate the change in the deer population from 1971 to 1980. They...
Curated OER
Pumped Up Gas Prices
Learners calculate gas prices. In this transportation lesson, students tally the mileage and gas costs of their car for one months. They figure out how much was spent on gas and create a graph showing average gas prices over time.
Curated OER
Judge and Jury
Learners participate in activities in which they focus on the uses of numbers. For this numerology lesson, students measure distances using standard and non-standard units and record their measurements in various tables. Learners also...
Curated OER
Slope
Students calculate the slope of a line. In this slope lesson, students use a graph, an equation or two points to help them calculate the slope of a line. They differentiate between a slope of zero and an undefined slope.
Curated OER
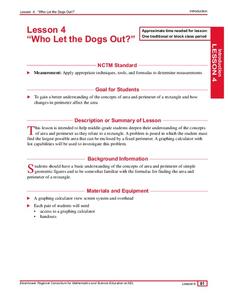
Who Let the Dogs Out?
Students examine the concepts of area and perimeter and how they relate to a rectangle. They find the largest possible area that can be enclosed by a fixed perimeter and complete a worksheet as well as create a table of all the possible...
Curated OER
Mass Spectrometer
In this mass spectrometer worksheet, high schoolers read about how a mass spectrometer determines the elements in gases around Earth. Students answer 3 questions and identify the elements in a graph found by a mass spectrometer.
Curated OER
"Mr. Betts and Mr. Potts"
First graders listen to the book "Mr. Betts and Mr. Potts" and examine the career of being a veterinarian. They categorize animals based on whether they could be house pets or not, develop a class pet graph, and list the various...
Curated OER
"Favorite Fairy Tale Characters"
Third graders enter the results of their survey on a spreadsheet. They construct a bar graph showing the results.
Curated OER
Ratios
Fourth graders complete a taste test of different sandwiches, rate them, and then put them in a ratio graph. In this ratio lesson plan, 4th graders write what they learned about ratios after this activity.
Curated OER
Cutting Cordwood
High schoolers examine a story problem in which two men are earning money by cutting cords of wood. They use data from graphs to use on a grid. They practice writing algebraic equations as well.
Curated OER
Weather... Or Not
Students observe and discuss the local weather patterns, researching cloud types and weather patterns for cities on the same latitude on the Internet. They record the data for 6-8 weeks on a graph, and make weather predictions for their...
EngageNY
Normal Distributions (part 2)
From z-scores to probability. Learners put together the concepts from the previous lessons to determine the probability of a given range of outcomes. They make predictions and interpret them in the context of the problem.
Other popular searches
- Data Tables and Graphing
- Graphs and Data Tables
- Create Data Tables From Graphs
- Data Displays and Graphs
- Data Reading Graph Table


