Curated OER
Find Equivalent Fractions Problem Solving 18.6
In this fractions worksheet, students analyze a data table with fractions that show screw lengths in Phillips and flat head screws. Students solve 5 word problems about equivalent fractions in the data table.
Curated OER
Asthma Survey
Learners collect survey data on the prevalence of asthma in a community. They summarize and display the survey data in ways that show meaning.
Curated OER
Barrier Islands
Third graders explore how barrier islands work. In this erosion lesson, 3rd graders create barrier islands in stream tables and simulate wave action to see how it affects their island.
Curated OER
Analyzing Graphs
For this statistics and probability worksheet, students analyze frequency distribution tables or histograms and box and whisker plots. The two page worksheet contains four multiple choice questions. Answers are included.
Curated OER
Analyze and Interpret Statistical Information
For this probability and statistics worksheet, 9th graders analyze and interpret histograms as they identify trends in the data. The two page worksheet contains four problems. Answers are provided.
Curated OER
Kevin's Camp Schedule
In this elapsed time worksheet, students study a camp schedule of activities. Students solve 5 story problems using the information in the table.
Curated OER
Mean, Median, and Mode
Fourth graders compare two sets of data by using a double bar graph. For this data analysis lesson, 4th graders study a double bar graph and complete questions based upon the data. Students construct a table to show the data from the...
Curated OER
FOLLOW THAT WATER
Students build simple stream tables and vary the angle of the stream tables in order to simulate different flow rates and compare the results. They observe various features formed in a stream table by flowing water and compare these to...
Curated OER
Estimate Products
In this estimating products instructional activity, students interpret data on the yearly diets of the average American, then solve 6 word problems where they must estimate products by rounding the larger factor to its greatest place value.
Curated OER
Conditions at Sea Introductory Activity, Making Waves
Students explore waves and wind. In this physical and earth science wave instructional activity, students participate in a wave making activity with an aquarium and a hair dryer. Students complete a data chart recording wave height and...
Curated OER
Element Scavenger Hunt
In this elements, worksheet, students use the periodical table to determine the origin of the element names such as elements named after countries, people, colors and towns. This worksheet has 71 fill in the blank questions and 1 short...
Curated OER
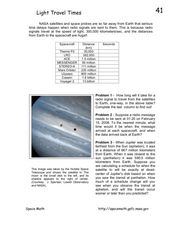
Light Travel Times
In this travel time of light worksheet, students read about the NASA satellites and space probes that transmit radio signals at the speed of light across huge distances. Students solve 3 problems about data transmission from space to...
Curated OER
Measuring the Effect of Adrenaline on the Heart Rate of Zebra Fish
Students investigate the heart beat of zebra fish in timed intervals. They record the heart beats and average three counts to display in their data tables. They repeat these steps increasing the adrenaline solution.
Curated OER
Freshman Project-Part 6-Final Written Report
In this project worksheet, students complete a formal write up of their experiments. This includes a rationale, a purpose, a hypothesis, their experimental design, materials, procedure, data tables with variables, graphs and a concluding...
Curated OER
Introduction to Graphical Representation of Data Sets in Connection to Cellular Growth
Students practice graphing relationships between variables by studying topics such as exponential growth and decay. They conduct a series of numerical experiments using a computer model and a variety of physical experiments using mold,...
Curated OER
Use a Graph Reteach 4.8
For this graph worksheet, students solve 3 problems using a data table and bar graph. Students write number sentences to figure out answers to the questions about kinds of toys in a shop.
Curated OER
Graph: Number of Laysan Albatross Nests and Chicks at Kilauea Point
In this bar graph worksheet, students solve and complete 2 problems related to reading a bar graph. First, they use the data table found at the bottom of the sheet to complete the bar graph which illustrates the number of nests and...
Curated OER
Handling Data- Health Statistics
In this social studies worksheet, students organize 50 country cards into groups. Students analyze a chart and group countries according to lowest, middle, and highest Infant Mortality Rate.
Curated OER
Positive Future Fair Project
Ninth graders view the film "Pay It Forward" and discuss what kind of public campaign is needed to move people to positive action. They consider different ways of presenting information (graphs, visual displays, etc.) as tools for...
Curated OER
Completing Frequency Diagrams from Displayed Data
In this frequency diagram worksheet, students use a bar chart, stacked bar chart and pie chart to complete frequency tables. A reference web site is given for additional activities.
Curated OER
Let's Get Linear
Math whizzes utilize spreadsheets to examine linear modeling. They roll marbles down a ramp from three different heights and measure how far they roll. They use Excel to record their data and create a plot of their data.
Curated OER
Understanding the Bush Tax Cut Plan
The class examines the new tax cut plan proposed by President Bush. They practice calculating income tax rates and interpreting the data. Then they research topics that are of interest to them related to taxes.
Curated OER
Human Body Series - Cardiovascular System
Pump up your class while studying the cardiovascular system with this pair of activities. In one, learners record heart rates during different actions. In the second, they read kid-friendly heart health articles online and then write a...
Curated OER
Pollution and Environmental Studies- Daily Water Use
In this environmental studies worksheet, students create a data table to discover how much water each person uses on a daily basis and what it is used for. They complete a post activity to make and test solutions for pollution using a...
Other popular searches
- Creating Data Tables
- Science Data Tables
- Making Data Tables
- Organizing Data in Tables
- Data Tables and Graphing
- Graphs and Data Tables
- Data Tables and Charts
- Create Data Tables From Graphs
- Data Tables Lesson Plans
- Data Tables Surveys
- Pocket Data Tables
- Using Data Displays


