Curated OER
Range, Mean, Median, and Mode
Eighth graders find the range, median, mean, and mode of a data set. In this finding the range, median, mean, and mode of a data set lesson, 8th graders collect data about the high and low temperature for 10 different cities. Students...
Curated OER
Range, Mean, Median and Mode Through the Internet
Middle schoolers compute measures of central tendency. In this range, mean, median and mode lesson, students gather information on the internet, organize the data and then compute the measures of central tendency. They create a...
Curated OER
Fruit Loop Graphing
Fifth graders interpret data and create graphs. Given Fruit Loops, they sort and classify according to color. Using spreadsheet technology, 5th graders record their data and create bar and circle graphs. Students analyze data and...
Curated OER
Mapping The Ocean Floor
Young scholars explore and analyze the bottom structure of underwater habitats. They describe and explain what can't see through the collection and correlation of accurate data. Learners assess that technology is utilized as a tool for...
Curated OER
Get On Board
Students create a ticket table illustrating the cost of tickets by alternative transportation. In this number sense lesson, students write number sentences to compare and contrast difference information in their chart. Students figure...
Curated OER
Identifying My Spider
Third graders navigate the Internet and research spiders. In this spider instructional activity, 3rd graders view photos of spiders and use their characteristics to determine the variety of spider. Students complete a spider data sheet.
Curated OER
Energy and Changes of State
Young scholars complete a variety of labs to help them explain how energy affects the changes in states of matter. They also be required to collect and record data, graph data, and apply interpretations of that data.
Curated OER
It'll Go With the Flow...
Students construct a water table elevation contour map and consider the direction and rate of groundwater flow to predict the actual runoff pattern. They discuss their findings and evaluate a hypothetical landfill site based on data...
Curated OER
State Economy Chart
Fifth graders research and record statistics on the economy of an assigned state. They create a spreadsheet in Excel to report the data and a 3D Pie graph using the Chart Wizard in Excel to represent their states' data.
Curated OER
Count The Letters
Students perform activities involving ratios, proportions and percents. Given a newspaper article, groups of students count the number of letters in a given area. They use calculators and data collected to construct a pie chart and bar...
Curated OER
Bunny Cakes and Graphing
Third graders graph and analyze data relating to the book "Bunny Cakes" by Rosemary Wells. They listen to and discuss the book, vote on their favorite cake using Excel computer software, and discuss the results.
Mathematics TEKS Toolkit
Grade 6: Exploring c/d = pi
Introduce your math class to the perimeter of a circle. Teach them that pi describes the relationship between the circumference and the diameter. As a hands-on investigation, pairs or small groups use string to compare these two values...
Curated OER
Genetic Drift
Students use a mathematical simulation of genetic drift to answer questions about the factors that influence this evolutionary process. They run a series of simulations varying allele frequency and population size and then analyze their...
Curated OER
Global Warming Statistics
Learners research and collect data regarding temperature changes for a specific location and find the mean, median, and mode for their data. In this climate change lesson plan, students choose a location to research and collect data...
Curated OER
Comparing the Health and Lifestyles of 13 Year-olds Around the World.
Eighth graders examine international data and statistics to evaluate the health and trends of 13 year old students around the world.
Curated OER
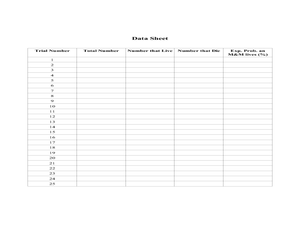
RIP M&M's
Students solve theoretical probability problems. In this algebra lesson, students apply the concept of probabilities to solving real life scenarios. They collect data and graph it using experimental probability.
Curated OER
Volcano Hazards
Students research volcano hazards in VolcanoWorld, make a paper volcano, produce and watch the effects of ashfall, produce and watch the effects of a mudflow and create a hazard map by plotting historical ashfall/mudflow data from Mount...
Curated OER
How Do Populations Grow?
Students examine how populations grow and how invasive species can affect the balance of ecosystems. They simulate the growth of lily pads, analyze and record the data, and simulate the results of an invasive species on an ecosystem.
Curated OER
Teaching Radioactive Decay: Radioactive Half-life And Dating Techniques
Students generate a radioactive decay table for an imaginary element using a box filled with pinto beans and M&M's. They use their data to plot a decay graph, develop the concept of half-life, and use the graph to "age" several samples.
Curated OER
What on Earth is a Biome?
Students explore organisms and their environments. They examine change over time
demonstrate an understanding of physical positions on Earth. They survey earth's diversity, write a report, fill in a data table created on the...
Curated OER
Experiment on Measuring Reaction Rates
High schoolers investigate the rate of a chemical reaction. In this rate of reactions lesson plan, students use an electronic balance to measure the change in mass of a chemical reaction between hydrochloric acid and calcium carbonate....
Curated OER
Don't Be a Square
Students analyze the relationship between radius and diameter. Students read Sir Cumference and the First Round Table then take measurements of circular items from around the room. Students compute the radius, diameter and...
Curated OER
The Apple Orchard Problem
Students explore various approaches to solving a problem of maximizing the total production of apples in an orchard. In this apple orchard lesson, students collect data in order to solve the apple orchard problem presented. Students plot...
Curated OER
You Light Up My Life
Students examine the relationship between solar activity and the Earth's geomagnetic field in producing the phenomena known as aurora borealis (Northern Lights) by reading and discussing "Earth, Wind and Fireworks." students graph data...
Other popular searches
- Creating Data Tables
- Science Data Tables
- Making Data Tables
- Organizing Data in Tables
- Data Tables and Graphing
- Graphs and Data Tables
- Data Tables and Charts
- Create Data Tables From Graphs
- Data Tables Lesson Plans
- Data Tables Surveys
- Pocket Data Tables
- Using Data Displays


