Curated OER
What Are My Chances?
Students calculate probability. In this lesson on probability, students use given data to calculate to chances of a given event occurring. Many of the calculations in this lesson are applicable to daily life.
Curated OER
Getting Out of Line
Young scholars explore basic connections between graphs, tables, and symbolic representations for lines, parabolas, inverse models, and exponential models. One of the primary goals of this lesson plan is to help students begin to...
Curated OER
History of Rock
Students study a specific type of rock then share that expertise with other students in small groups. They view a rock and write observations about the rock to form small groups. In addition, they present their rocks an obervations to...
Curated OER
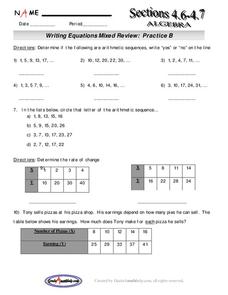
Writing Equations Mixed Review
Learners write equations based on a pattern. In this algebra lesson, students calculate the arithmetic and geometric mean of a sequence. They rewrite word problems as a linear equation and solve real life scenario based on the given data.
Curated OER
E. coli and Their Human Environment
High schoolers are able to observe how environmental changes (antibiotics) affect the growth of E. coli. They are able to use the "F" test for statistical analysis. Students can explain that E. coli is a common rod-shaped intestinal...
Curated OER
What's in the Water?
Fifth graders use the dots to simulate water pollutants in a lake. They use cups to collect a sample of "water." Students sort the dots by color and record the number of each dot color under the correct pollutant name in the Lake Water...
Curated OER
Bar Graphs
Third graders investigate bar graphs. In this third grade mathematics lesson, 3rd graders collect and analyze data and use the internet’s Graph challenge to create their own graphs. Students write questions for the other students to...
Curated OER
Pythagorean Theorem Spreadsheet
Studetns use a spreadsheet to organize data on the sides of a triangle. They use the Pythagorean Theorem and the If then spreadsheet function to decide whether the three sides determine a right triangle. Middle schoolers work...
Curated OER
Name That Tune: Matching Musical Tones Through Waveform Analysis
Pupils detect the waveform of musical notes to determine the code for the "safe" in this forensics simulation lesson. They use a microphone and tuning forks along with Vernier EasyData on their graphing calculator to analyze five musical...
Curated OER
Density Lab
Students find the density of two substances. In this density lesson plan, students determine the density of water and ethyl alcohol and compare their densities. They enter their data into the computer to produce a class compiled graph....
Curated OER
Counting Animal Populations
Students learn how to count animal populations by the Mark and Recapture method. In this counting animal populations lesson plan, students begin by predicting amounts of different candies in a jar. Students then simulate using beans, two...
Curated OER
River Optimization Problem
Students define the different methods used for optimizing a particular element of a problem. In this optimization problem lesson, students optimize appropriate details of a problem using data collection, algebra, technology, and/or...
Curated OER
Shopping Mall Math
Students interpret given data. In this mall math lesson, students identify the percent of given amounts, they estimate area, interpret data, compute percent, and examine scale drawings.
Curated OER
ACC Basketball Statistics
Middle schoolers use math skills and create a spreadsheet. In this statistics and computer skills activity, students gather ACC basketball statistics, convert fractions to decimals and then percents. Middle schoolers use the gathered...
Curated OER
The Fact Finders
Students analyze agricultural data and make predictions about events in history. In this history instructional activity, students correlate the relationship between historic events and issues in agriculture to see if there is a...
Curated OER
Scatter Plots
Seventh graders investigate how to make and set up a scatter plot. In this statistics lesson, 7th graders collect data and plot it. They analyze their data and discuss their results.
Curated OER
Explore Your Natural Habitat
Students identify habitats and understand why they are important to our environment. In this environmental lesson students design their own habitat, observe and record data on the impact their habitat has on the environment.
Curated OER
Endocrine Disruptors in Our Drinking Water: Should We Be Concerned?
Young scholars investigate the different hormone contaminants in the water supply. In this math lesson, students analyze data tables and graphs. They demonstrate exponential growth and decay using frog populations.
Curated OER
Beginning Statistical Inquiries into the Scientific Method: Jelly-Side-Down
Students describe what happens when a piece of jellied toast is dropped off a table. From these observations, students pose a question concerning which side of the jellied toast land on the floor.
Curated OER
Graphing
Learners investigate graphing. In this bar graph lesson, students view an informational website about graphing, then construct a class birthday bar graph outside with sidewalk chalk. Learners choose a survey topic, then collect data and...
Curated OER
Spaghetti Bridges: Student Worksheet
In this math worksheet, students will create a "bridge" out of spaghetti and test it's strength with pennies. Students will record their results on a table and then graph the results.
Curated OER
Shoe Classification Lab
Students use shoes to make a classification flow chart. In this classification lesson plan, students all take one of their shoes off and put it on a table. In groups they create a classification system based on 3 characteristics of the...
Curated OER
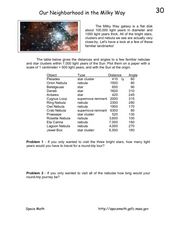
Our Neighborhood in the Milky Way
In this Milky Way galaxy worksheet, learners are given a table of distances and angles of nebulae and star clusters from the sun. Students plot each one on a piece of paper and solve 2 problems using the data.
Curated OER
TI-Nspire Activity: What Does Your Representation Tell You?
By learning to select the best representation for three meal plans, students compare three meal plans to determine the best choice. Data for the meal plans is sorted on a table, as an algebraic equation, and graphed on a coordinate grid....
Other popular searches
- Creating Data Tables
- Science Data Tables
- Making Data Tables
- Organizing Data in Tables
- Data Tables and Graphing
- Graphs and Data Tables
- Data Tables and Charts
- Create Data Tables From Graphs
- Data Tables Lesson Plans
- Data Tables Surveys
- Pocket Data Tables
- Using Data Displays


