Curated OER
Differential Thermal Calorimetry
High schoolers access prior knowledge of infrared rays, ultraviolet rays, gamma rays, x-rays and cosmic waves. In this electromagnetic waves lesson, students hold a mock trial electromagnetic spectrum. High schoolers present...
Curated OER
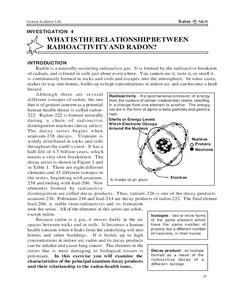
What is the Relationship Between Radioactivity and Radon?
In this radon and radioactivity worksheet, young scholars analyze the data of the isotopes of elements that occur in the decay series of uranium-238. Students answer 6 questions about the isotopes, their half-lives, their potential...
Curated OER
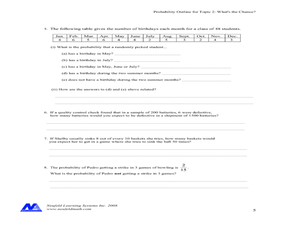
Concept: What's The Chance?
In this concept worksheet, students perform probability experiments. Using collected information, they interpret the data. Students answer questions about probability. This five-page worksheet contains approximately 15 multi-step...
Curated OER
Its OK To Be a Clod
Students describe factors that affect the solubility of a chemical substance in seawater. In this sea environment lesson, student explain how information on the solubility of a substance can be used to measure water currents. They will...
Curated OER
Water, Water Everywhere
Learners explore water. In this water absorbency instructional activity, students experiment with different items to see if they absorb water. Learners record their findings on a data sheet. Students then try making music with drinking...
Curated OER
Green Food Graph
Students explore graph making by investigating St. Patrick's day food. In this holiday food lesson, students discuss their favorite green foods in honor of St. Patrick's day. Students create a graph based on the data of which green foods...
Curated OER
Journalism
Students insert raw data about Ad sales into an Excel chart. They use raw data in a letter to local businesses by using the Mail Merge program. They represent data using tables and graphs.
Curated OER
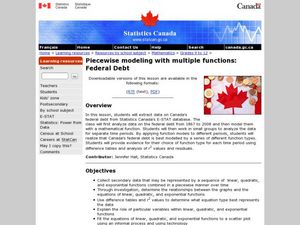
Piecewise Modeling with Multiple Functions: Federal Debt
Students analyze data on debt and write an equation. In this statistics lesson, students are given data from different time periods, and are asked to graph and analyze the data. They work in groups, and are assigned different parts of...
Curated OER
Household Acids and Bases
Ninth graders complete an experiment to determine the pH values of a variety of common household substances. They use red cabbage to find the indicator colors of the pH range. They complete a data table that includes a prediction and...
Curated OER
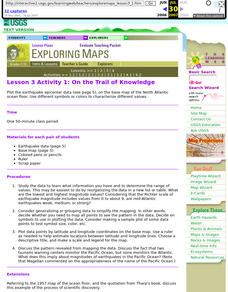
Lesson 3 Activity 1: On the Trail of Knowledge
High schoolers plot the earthquake epicenter data on the base map of the North Atlantic ocean floor using different symbols or colors to characterize different values.
California Academy of Science
Measuring Earthquakes
After a brief discussion on earthquakes, make a makeshift seismograph to record the shaking of the table that it sits upon. While the background information will be useful to you as a teacher, the seismograph does not seem like it would...
Curated OER
Community Wellness Fair
Twelfth graders list ideas to create a wellness fair. They form student committees to organize times for each class to participate in the fair. Students assist in setting up the fair by putting up tables for the exhibitors, preparing...
Curated OER
Invasion of the (Cactus) Booty Snatchers
Students, in groups of four,identify and analyze relationships among birds within a population, a community and an urban ecosystem. They fill out, while they're completing their experiments, a Populations of Birds Student Data Sheet.
Curated OER
Shopping Around
Third graders select a recipe and compare prices for ingredients at two different stores. They select the best place to buy the ingredients and answer questions about the process. They include their data on a spreadsheet related to their...
Curated OER
Analyzing Political Cartoons
Seventh graders identify a political cartoon and analyze a pre-Revolutionary War political cartoon. In this political cartoon instructional activity, 7th graders discuss cartoons and the historical beginnings of American politics using a...
Curated OER
Apple Logic and Problem Solving
Students examine apple production in the United States. In this interdisciplinary lesson, students use problem solving strategies introduced to solve math problems associated with apple production in the United States. Student collect...
Curated OER
Environmental Graphing
Young scholars experiment with graphing. In this graphing introduction lesson plan, students complete four activities: 1) a bar graph based on class birthdays 2) an estimation graph of the raisins in raisin bread 3) another estimation...
PHET
AM Radio Ionosphere Station
Tune in! Young scientists use an AM radio at home to monitor solar output. The long-term project would be ideal in a flipped classroom or as an out-of-class project.
Polar Trec
Bering Sea Fabulous Food Chain Game
In spring, the Bering Sea turns green due to phytoplankton, which live at the surface, experiencing a population explosion. Groups of scholars play a food chain game, writing down food chains as the game is played. After five to six...
EngageNY
Informally Fitting a Line
Discover how trend lines can be useful in understanding relationships between variables with a lesson that covers how to informally fit a trend line to model a relationship given in a scatter plot. Scholars use the trend line to make...
Polar Trec
Who Will Melt First?
If the Greenland ice sheet melted, sea levels would rise by about 20 ft; if the Antarctic ice sheet melted, sea levels would rise by 200 ft. Scholars explore ice melting through the analysis of different ice samples, clean and dirty ice....
Virginia Department of Education
Road Trip
Help plan a road trip with linear equations. Scholars consider two different rental car companies and write equations representing the cost for each company. They graph the system of equations to determine the conditions under which each...
NOAA
Mapping the Deep-Ocean Floor
How do you create a map of the ocean floor without getting wet? Middle school oceanographers discover the process of bathymetric mapping in the third installment in a five-part series of lessons designed for seventh and eighth graders....
SRI International
The Water Crisis
Water, water, everywhere, right? Wrong. Learners assess their own knowledge of water availability on Earth. Then, through a reading, a teacher-led presentation, and an activity, pupils learn about the importance of available clean...
Other popular searches
- Creating Data Tables
- Science Data Tables
- Making Data Tables
- Organizing Data in Tables
- Data Tables and Graphing
- Graphs and Data Tables
- Data Tables and Charts
- Create Data Tables From Graphs
- Data Tables Lesson Plans
- Data Tables Surveys
- Pocket Data Tables
- Using Data Displays


