Curated OER
Mapping The Ocean Floor
Young scholars explore and analyze the bottom structure of underwater habitats. They describe and explain what can't see through the collection and correlation of accurate data. Learners assess that technology is utilized as a tool for...
Curated OER
Get On Board
Students create a ticket table illustrating the cost of tickets by alternative transportation. In this number sense lesson, students write number sentences to compare and contrast difference information in their chart. Students figure...
Curated OER
Let's Keep Track of Grades
Learners participate in a technology project. This lesson is a hands-on spreadsheet project where students are responsible for keeping track of their grades for class. The learners learn to enter data into a spreadsheet, create...
Curated OER
Ocean Currents and Sea Surface Temperature
Students use satellite data to explore sea surface temperature. They explore the relationship between the rotation of the Earth, the path of ocean current and air pressure centers. After studying maps of sea surface temperature and ocean...
Curated OER
Is Global Warming Affecting Hurricanes?
In this hurricane worksheet, students use data charts showing the number of hurricanes and the severity of these hurricanes to determine if global warming is causing an increase in hurricanes. This worksheet has 2 short answer questions.
Curated OER
Star Light, Star Bright: Exploring How Stars are Classified
In this star classification worksheet, students are given laminated star charts to make observations about stars. They work in groups to classify groups of stars based on different characteristics. For each group of stars they list at...
Curated OER
How Long? How Wide?
Second graders distinguish between and use nonstandard and standard units of measurement, use appropriate tools and techniques to measure length and width, and record and interpret data using graphs.
Curated OER
What Are My Chances?
Students calculate probability. In this lesson on probability, students use given data to calculate to chances of a given event occurring. Many of the calculations in this lesson are applicable to daily life.
Curated OER
Graphing
Students investigate graphing. In this bar graph lesson plan, students view an informational website about graphing, then construct a class birthday bar graph outside with sidewalk chalk. Students choose a survey topic, then...
Curated OER
Ecosystem Interactions in Refuges
Seventh graders, using national parks as models, illustrate the energy flow in ecosystems. Working in groups, they use murals, flow charts, or other visual displays to record their findings. Students represent the food chains and webs...
Curated OER
Which Muscles?- Olympic Learn and Play Sports
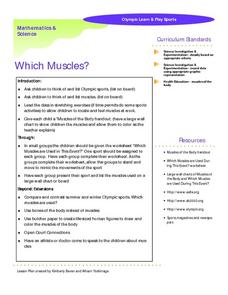
In this math, science, and physical education worksheet, students brainstorm and study about the muscles that are used while participating in different Olympic sports. They color the muscle groups of the body by follow the directions...
Curated OER
The Seasonal Round and The Cycle of Life
Fourth graders are introduced to the concept of the seasonal round and how folklife traditions vary from season to season. They begin charting dates of personal interest on seasonal round calendars by starting with birthdays. Students...
Curated OER
A Day at the Beach
Student read Sheryl Wilson's story, "A Day at the Beach" while classifying items they find. They design a chart of the items before using educational graphing software to create a graph.
NOAA
Mapping the Deep-Ocean Floor
How do you create a map of the ocean floor without getting wet? Middle school oceanographers discover the process of bathymetric mapping in the third installment in a five-part series of lessons designed for seventh and eighth graders....
Virginia Department of Education
Permeability and Porosity
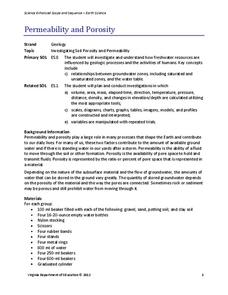
Covering both permeability and porosity, scholars perform a hands-on experiment testing various soil types. The material includes a pre-instructional activity worksheet to help focus pupils on the task at hand.
Delegation of the European Union to the United States
The Geography of Europe
What is the European Union? Where is it? Why is it? To begin a study of the EU, class members examine the physical geography of Europe and the size and population density of 28-member countries in comparison to non-member countries...
Wild BC
Bearly Any Ice
After reviewing food chains, your class members participate in an arctic predator-prey game that exemplifies the impact of climate change of food availability. If you are in a hurry, skip this lesson, but if you have the time to...
Curated OER
Simple Harmonic Motion
Back and forth, and back again. A presentation on harmonic motion would make a great backdrop for a directed instruction lesson in Honors Physics. It includes diagrams, formulas, graphs, and a few sample problems.
Curated OER
Keep It Cool
Students complete a science experiment to study insulation, heat transfer, and permafrost. In this permafrost study instructional activity, students design and test a soda insulator. Students graph their class data and discuss the...
Curated OER
Putting Your Best Foot Forward
Third graders measure their feet and their parents' feet, record data on computer-generated graphs, and calculate and record mean, median, and mode.
Curated OER
Graphs Galore
Fourth graders conduct surveys to collect data. They analyze and interpret the data, then determine which type of graph is appropriate for the data. Students use the data to make predictions, discover patterns and draw conclusions...
Curated OER
Comparison of Snow Cover on Different Continents
Learners use the Live Access Server (LAS) to form maps and a numerical text file of snow cover for each continent on a particular date. They analyze the data for each map and corresponding text file to determine an estimate of snow cover...
Curated OER
Doing The School Run
Learners explore finding the percent of a numbers. They survey their peers to determine modes of transportation used in getting to school. Afterward, students organize information and create graphs and charts. They explore alternative...
Curated OER
Tracking Your Favorite Web Sites
Ninth graders track the hit count on their favorite web sites. In this Algebra I instructional activity, 9th graders record the number of hits on their favorite web site for twenty days. Students explore the data to determine...


