Curated OER
The Miracle Fish: Learning to Design an Experiment
Students develop procedures to explore the behavior of fish. In this scientific experiment lesson plan students from a hypothesis, write a question, identify different variables and controls in their experiment.
Curated OER
Wheat Kernels Bar Graph
Third graders create a bar graph to record how many kernels were in a wheat stalk. They write in math journals two questions from interpreting the graph. They solve math problems from other students.
Curated OER
Getting To School: Loving It Or Loathe It?
Students engage in a study looking at the problem of transportation to school. They conduct research using a variety of resources. The information is used in order to work together to come up with possible solutions based upon current...
Curated OER
Landfill Project
Students explore impact of garbage on environment, examine waste management operations and how they can directly impact environment, implement ways to lower household garbage, and make STELLA Model about garbage flow and use model to...
Curated OER
The Difference Between Comets, Meteors And Asteroids
Students use Venn diagrams to highlight the similarities and differences between comets, meteors, and asteroids.
Curated OER
Design-A-Room Project (Part 3 of 3)
Students culminate a unit on measurement with a focus on area and perimeter. They design a floor plan of their dream room on graph paper showing the proper area and perimeter. They plan the budget for their room and make a 3-D scale...
Curated OER
Double, Double: Looking at the Effect of Change on Perimeter, Area and Volume
Students explore perimeter, volume, and area. In this math lesson, students explore how changes in dimensions of geometric shapes affect the perimeter, area and volume of the various shapes. Students investigate the results when the...
Curated OER
Mathematical Magazines
Young scholars classify and tabulate the type of advertisements found in a collection of magazines. Determination is made on what percent of the total number of ads each type represents. They present their results orally and in a graph.
Curated OER
C is for Cookie-A MEAN-ingful Graphing Activity
Third graders, in groups, dissect a variety of brands of chocolate chip cookies and calculate the mean for each brand. They create their own bar graphs, pictographs, and line graphs to represent information.
Curated OER
Arrange the Classroom (Part 1 of 3)
Fifth graders arrange the classroom using all the moveable objects and through the exploration of area and perimeter. They determine the area of the classroom, create and label model pieces of furniture using graph paper, and create a...
Curated OER
A Statistical Look at Jewish History
Students complete their examination over the Jewish Diaspora. Using population figures, they discover the importance of percentages in exploring trends. They use their own ethnic group and determine how it is represented in the United...
Curated OER
Web-search And PowerPoint Presentations-The Cell
Sixth graders create a PowerPoint presentation using information that they have compiled from their web search and rubric web sites, text and other applicable references. They work in pairs to complete these searches and projects.
Curated OER
Magnetism and the Magnetic Force
Fourth graders investigate magnetism and the magnetic force.
Curated OER
Technology vs. Nontechnology
Fourth graders determine the range, mean, median and mode using a computer spreadsheet. An identical set of calculations is done without using a computer. The results of each method are compared. They calculate the mode, median and range...
Curated OER
Ecology and the Conservation of Natural Resources Lesson 2
Students compare and contrast abiotic and biotic factors. They discuss how these factors effect ecosystems. They answer questions to complete the lesson.
Curated OER
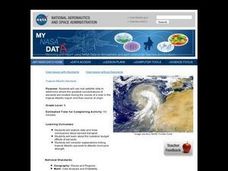
Troical Atlantic Aerosols
Students explore the effect aerosols have upon he weather and climate. They observe NASA satellite images to explore and draw conclusions about aerosol transport. From studying the images, students track the path of aerosols. They...
Curated OER
Russian Dolls Investigation
Students measure a set of Russian dolls using the metric system. In this measurement lesson plan, students identify certain relationships between sets of measurements by measuring a set of Russian dolls and presenting their findings to...
Curated OER
Animal Research Project
Third graders prepare an oral report using Appleworks to present information on their animal. They write a short narrative comparing and contrasting their animal to another students and, after watching other presentations, discuss what...
Curated OER
Graphing Our Favorite Candy Bars
Students use ClarisWorks to graph class' favorite candy bars on a bar graph.
Curated OER
Where We Live
Students analyze Canada's population distribution. They access online information to gather demographic information about two Canadian cities. They compare and contrast the quality of life in the two cities and present their findings.
Curated OER
Help! I Need Five Minutes
Students practice ways to better manage their time. They keep track of their current use of time. Students prioritize and schedule events and use a daily planning calendar to schedule their time.
Curated OER
The ABC's of Industry
Students define and explore Industry. They access times during the Industrial Revolution in America. Students view how business functions in any economy. They summarize the three sectors of industry by creating and interpreting a web...
Curated OER
Flush It! Throw It! Out of Sight, Out of Mind!
Students describe disposal procedures by reviewing water and solid waste disposal cycles and what happens when one step is omitted. They examine the connection between industry and human health.
Curated OER
Publishing Autobiographies 2
Eighth graders identify the 5th step of the writing process and apply the process to student autobiographies. While in the computer lab, they continue to type their autobiographies, and create covers for their autobiographies.


