Curated OER
Using Scholastic News to Introduce the Net
Third graders log on to the net, type in the address for Scholastic and browse the subjects for the week. They select one area of interest and generate five interesting facts about the article.
Curated OER
Micro-Magic With Sticky Ions
Students view a video about the formation of precipitates. They complete a worksheet that asks them to identify what makes a compound form and what holds it together.
Curated OER
Carbondale: The Biography of a Coal Town
Students use a brief history of the growth and decline of the anthracite region in the state to create a photograph and map "peak shaped" time line. They practice map and photo analysis strategies to "read" photographs and maps.
Curated OER
CURRENT AND CLIMATE
Learners study currents and how they have been used to plot courses for travel. They examine the ocean currents in both the Atlantic and Pacific and discuss their effect on local weather.
Curated OER
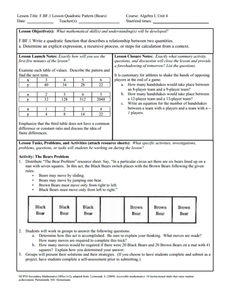
Bears
Young scholars complete a variety of bear-related activities. They sort and graph teddy bears, distinguish between real and non-real bears and research bear life cycles and habitats.
Curated OER
MFL: Young Drivers
Students examine and discuss images from road safety programs. In groups, they role-play a scenerio in which they are trying to persuade the other to adopt an unsafe driving practice. They write a short article about their experiences to...
Curated OER
What Are Alternative Fuels? Concept Mapping Alternative Fuels Investigation
Students compare and contrast the different types of alternative fuels. They create a concept map to understand their classification. They examine the properties of matter and energy as well.
Curated OER
Saving An Endangered Species
Second graders work in groups in order to look at specific internet sites for animal adoption and sponsorship. They select an endangered species, determine needed funds, develop, advertise, and carry out a fund-raising plan.
Curated OER
Civil War Letter Web
Students use the internet to gather information on a specific Civil War battle of interest to them. Using the information they gather, they organize it into a web to be used later when writing a letter. They use the web to write their...
Curated OER
Instructional Software Resources for Grades K-3
Learners become familiar with teh selection, evaluation, and use of instructional software for 4-8 classroom. They download software demos from the web and discuss critiquing software. Students browse software evaluations on web sites.
Curated OER
Global Symposium
Ninth graders work together to develop a sysnopis on the Earth. Using the Internet and print sources, they focus on one country to research and determine its condition. They offer possible solutions to the problem and share their...
Texas Instruments
Texas Instruments: Mc Dougal Littell Middle School Math: Making Data Displays
Students will create data displays using a scatter plot and a line graph of the data and a circle graph of survey data.
Khan Academy
Khan Academy: Calculating the Median: Data Displays
Practice computing the median of data sets presented in a variety of formats, such as frequency tables and dot plots. Students receive immediate feedback and have the opportunity to try questions repeatedly, watch a video or receive hints.
CK-12 Foundation
Ck 12: Elem Math: Length Comparisons Using Data Tables
[Free Registration/Login may be required to access all resource tools.] The video shows how to use a data table to answer questions comparing length.
Oswego City School District
Regents Exam Prep Center: Practice With Organizing and Interpreting Data
Several problems are presented to test your skills in creating and interpreting frequency tables, pie charts, box-and-whisker and stem-and-leaf plots.
Texas Education Agency
Texas Gateway: Evaluating Data in Tables, Graphs and Charts
[Accessible by TX Educators. Free Registration/Login Required] In this lesson students look at examples of graphics, tables, charts, and graphs, and learn how to interpret their data. They will be able to use this skill to enhance their...
Cuemath
Cuemath: Pie Charts
A comprehensive guide for learning all about pie charts with definitions, solved examples, and practice questions.
BBC
Bbc: Ks1 Bitesize: How to Use Simple Data Tables
Explains how to read information from a simple golf scoring table. Students then label the rows and columns in a 2x3 table. [0:26]
Other
Online Statistics Education: Graphing Distributions [Pdf]
This is the second chapter of a statistics e-text developed collaboratively by Rice University, University of Houston Clear Lake, and Tufts University. It looks at many different types of data displays and the advantages and...
University of Cambridge
University of Cambridge: Maths and Sports: Charting More Success
This activity follows on from Charting Success and encourages students to consider and analyse representations of data from the world of sport, to make sense of the stories they tell, and to analyse whether the right representation has...
Khan Academy
Khan Academy: Creating Frequency Tables
Practice creating frequency tables from small data sets. Students receive immediate feedback and have the opportunity to try questions repeatedly, watch a video or receive hints.
University of Cambridge
University of Cambridge: Maths and Sports: Charting Success
Sports statisticians, trainers and competitors create graphs, charts and diagrams to help them to analyse performance, inform training programmes or improve motivation. This activity encourages students to consider and analyse...
Khan Academy
Khan Academy: Reading Dot Plots & Frequency Tables
Practice reading basic dot plots and frequency tables. Students receive immediate feedback and have the opportunity to try questions repeatedly, watch a video or receive hints.
Sophia Learning
Sophia: Using Graphs to Analyze Data
This lesson will demonstrate how to analyze and interpret data given in the form of a graph.


