Texas Education Agency
Texas Gateway: Informational Text: Synthesize Information in Charts and Graphs
In this lesson, you will learn how to understand the data found in charts and graphs, and at the end of the lesson, you will practice what you have learned.
Discovery Education
Discovery Education: Science Fair Central: Investigation Set Up and Collect Data
A brief overview of how to gather both quantitative and qualitative data, complete with a sample data table.
Better Lesson
Better Lesson: Building and Reading Tables With Three Digit Numbers
Second graders gain fluency in reading and building tables using three-digit numbers. This lesson includes a detailed plan, printable worksheets, a video showing students engaged in the lesson, and an exit ticket to assess understanding.
Texas Education Agency
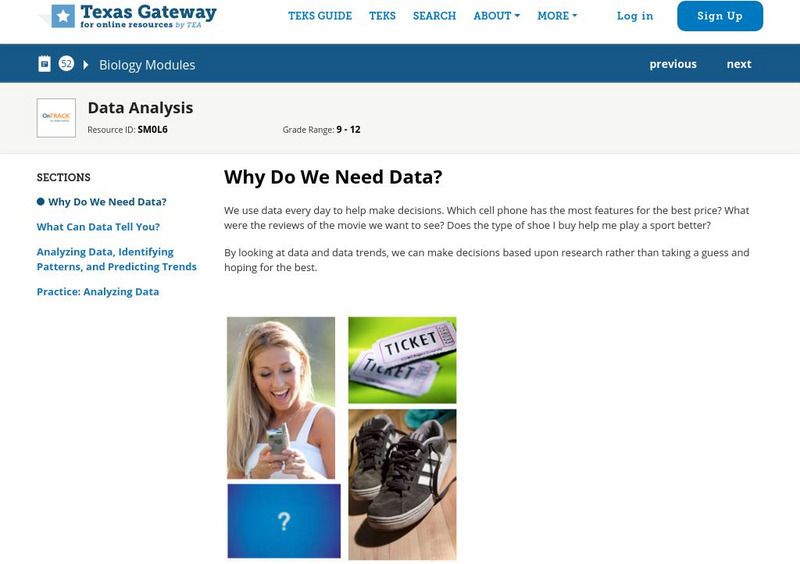
Texas Gateway: Data Analysis
Given laboratory investigation data in the form of tables, charts, and graphs, students will analyze and predict trends from the data.
Texas Instruments
Texas Instruments: Creating Charts
Students learn to represent data in a list as a bar chart. They examine statistics from the 2000 Olympic Games and determine the team that took home the most medals.
University of Texas
Inside Mathematics: Parking Cars [Pdf]
This task challenges a student to use their understanding of scale to read and interpret data in a bar graph.
Scholastic
Scholastic: Bars, Lines, and Pies
Young scholars will learn and reinforce skills for creating, applying and analyzing pie charts, bar graphs and line graphs.
E-learning for Kids
E Learning for Kids: Math: Tea Store: Reading a Table
Students will demonstrate how to interpret information in a table.
Other
Tulpehocken Area School District: Graphing and Analyzing Scientific Data
Student instructional activity with explanation of pie, bar, and line graphs, the parts of a graph, and the definition of mean, median, and mode. This summary is followed by an exercise for each type of graph within a scientific context.
ClassFlow
Class Flow: Cumulative Frequency Data Handling
[Free Registration/Login Required] Students draw conclusions and engage in tables and charts involving cumulative frequency; a wonderful review of student's knowledge.
Better Lesson
Better Lesson: Using Table Data: Time to the 1/2 Hour
My students have learned how to read and write time. Now I want them to see how important time is for us to organize our lives. I want them to use data charts for schedules and be able to analyze the information.
Khan Academy
Khan Academy: Creating Frequency Tables
In this exercise, students practice creating frequency tables. Students receive immediate feedback and have the opportunity to get hints and try questions repeatedly.
Khan Academy
Khan Academy: Comparing Data Displays
Practice interpreting and comparing dot plots, histograms, and box plots. Students receive immediate feedback and have the opportunity to try questions repeatedly, watch a video or receive hints.
University of Cambridge
University of Cambridge: Maths and Sports: Match the Matches
Decide which charts and graphs represent the number of goals two football teams scored in fifteen matches. This data handling activity is designed to get children talking meaningfully about mathematics, presenting and justifying...
The World Bank
World Bank Group: Gnp Per Capita
The World Bank Group offers an educational overview of GNP per capita. Content includes a map, charts, data, photos, cases, research, and exercises!
US Department of Education
National Center for Education Statistics: Create a Graph Tutorial
This tutorial walks students through how to create different types of graphs using the Create a Graph tool available on the website. Covers bar graphs, line graphs, pie charts, area graphs, scatter plots, and dependent and independent...
ClassFlow
Class Flow: Tally Table Lessons
[Free Registration/Login Required] This flipchart contains interactive pages to help students learn how to read and interpret tally tables. There are 7 different tally table pages with questions. There are some blank tables at the end of...
ClassFlow
Class Flow: Frequency Tables
[Free Registration/Login Required] Use this flipchart to model frequency tables. Students will create their own flipcharts with collected data as well.
ClassFlow
Class Flow: Interpreting Tables and Graphs
[Free Registration/Login Required] Explore a variety of graphs and tables. Many activities are incorporated to provide practice solving problems using different graphs and charts.
Better Lesson
Better Lesson: Circle Graph Activity
This lesson will allow the student to work through three stations. The stations will focus on creating and analyzing circle graphs. The students will be using technology to create their graphs along with a hands-on activity using M&M's.
Texas Instruments
Texas Instruments: Exploring Probability
In this activity, students learn to create a categorical list, then convert their data into a pie chart, and use it to answer questions.
Alabama Learning Exchange
Alex: Ice Cream Sundae Survey
Students quickly realize the importance of learning how to read and find information in charts, graphs, and tables compared to finding the same information written in a paragraph. This is a fun, high energy lesson!This lesson plan was...
Alabama Learning Exchange
Alex: Who Bounces Best?
This is a cooperative learning, kinesthetic and presentation lesson. Learners will use the computer to create graphs/charts to display data collected by counting the number of successful bounces when bouncing a basketball for 30 seconds....


