Curated OER
French Fry Run
Student explore estimation and measurement. In this measurement lesson plan, 2nd graders measure french fries, graph their data, and determine the size of french fries that is the best value. Students practice how to add prices and...
Curated OER
Burger King Investigation
Young scholars study data on the nutritional value of Burger King meals in order to discover its nutritional value and also to compare the meals, using mathematical computation, to the recommended daily diet. In this data handling...
Curated OER
Matrices: A Secret Weapon
Students perform operations with matrices. In this algebra lesson plan, students use cryptography and cryptanalysis to solve problems. They add, subtract, and multiply matrices.
Curated OER
Mathematics Within: Bar And Pie Graphs
Students compare and contrast the use of bar and pie graphs with the same data. They create a data set by surveying all students in the class using sticky notes to make a table on the board. Then, each student creates a bar and pie graph...
Curated OER
Using Radiosonde Data From a Weather Balloon Launch
Student use radiosonde data from a weather balloon launch to distinguish the characteristics of the lower atmosphere. They learn the layers of the atmosphere. They graph real atmospheric data.
Curated OER
Handling Data: Comparing Distributions
Young scholars gather information by analyzing graphs, diagrams and pie charts. In this graphs and diagrams lesson, students complete addition and subtraction problems. Young scholars discuss a pie chart. Students use information to...
Curated OER
Which Car Should I Buy?
Students use gas mileage of different cars to create T charts, algebraic equations, and graphs to show which gets better mileage. In this gas mileage lesson plan, students use the graph to see which car they should buy.
Curated OER
Asthma Survey
Learners collect survey data on the prevalence of asthma in a community. They summarize and display the survey data in ways that show meaning.
Curated OER
Conditions at Sea Introductory Activity, Making Waves
Students explore waves and wind. In this physical and earth science wave instructional activity, students participate in a wave making activity with an aquarium and a hair dryer. Students complete a data chart recording wave height and...
Curated OER
Introduction to Graphical Representation of Data Sets in Connection to Cellular Growth
Students practice graphing relationships between variables by studying topics such as exponential growth and decay. They conduct a series of numerical experiments using a computer model and a variety of physical experiments using mold,...
Curated OER
Positive Future Fair Project
Ninth graders view the film "Pay It Forward" and discuss what kind of public campaign is needed to move people to positive action. They consider different ways of presenting information (graphs, visual displays, etc.) as tools for...
Curated OER
Quarter, Nickel, Dime....
An engaging game called, "Quarter, Nickel, and Dime" is presented in this math lesson. Players are given an envelope with slips of paper that represent the three coins. In pairs, they play the game 18 times, and the whole class charts...
Curated OER
Waves
Light waves and sound waves are the focus of this science lesson designed for 5th graders. Besides discovering how these waves travel, learners also discover the basic properties of waves, and analyze data tables and graphs. The...
Curated OER
Exploring Renewable Energy Through Graphs and Statistics
Ninth graders identify different sources of renewable and nonrenewable energy. In this math lesson, learners calculate their own carbon footprint based on the carbon dioxide they create daily. They use statistics to analyze data on power...
Curated OER
Party, Party, Party
Second graders conduct investigations with counting, comparing, organizing, analyzing, displaying and interpreting data. They pose questions for investigation and collect the data. Students display the data in tally charts, uniform...
Virginia Department of Education
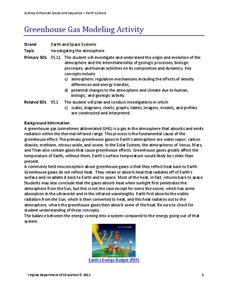
Greenhouse Gas Modeling Activity
Why are greenhouse gases called greenhouse gases? Young Earth scientists learn about greenhouse gases though experimentation in the second installment of a 3-part series. They use lamps to model radiant energy as well as warming through...
Curated OER
Exploration of "Pillbugs"
Fifth graders define vocabulary terms, identify the characteristics of a pillbug, and create a dichotomous key. Then they examine the pillbugs and make observations and record these observations. Finally, 5th graders observe specific...
Museum of Tolerance
Where Do Our Families Come From?
After a grand conversation about immigration to the United States, scholars interview a family member to learn about their journey to America. They then take their new-found knowledge and apply their findings to tracking their family...
Curated OER
Hurricane Frequency and Intensity
Students examine hurricanes. In this web-based meteorology lesson, students study the relationship between ocean temperature and hurricane intensity. They differentiate between intensity and frequency of hurricanes.
Curated OER
Show Me!
Students analyze and interpret graphs. In this graphing lesson, students view a video and construct their own graphs (line, circle, bar) from given sets of data.
Curated OER
Education for Global Peace
Fifth graders construct data graphs based upon sets of data. In this graphing instructional activity, 5th graders read the text If the World Were a Village and discuss how types of graphs accurately represent a large population. Students...
Curated OER
Hopes and Dreams: A Spreadsheet Lesson Using Excel
Fourth graders read "The Far Away Drawer" by Harriet Diller and discuss the story as a class. After discussion, 4th graders create a t-shirt GLYPH about their hopes and dreams,share their information with the class and create spreadsheets.
Curated OER
Awesome Animals
Students collect data from classmates about their favorite animal. They use the ClarisWorks graphing program to enter data, graph results, and interpret data.
Curated OER
Snow Cover By Latitude
Students examine computerized data maps in order to create graphs of the amount of snowfall found at certain latitudes by date. Then they compare the graphs and the data they represent. Students present an analysis of the graphs.


