Curated OER
That's Predictable - Stream Side Science
Research the impact that changes in biotic or abiotic factors might have on an ecosystem. Debate for or against the changes and take action in the community. This resource ideally follows stream studies that young ecologists may have...
EngageNY
Modeling Relationships with a Line
What linear equation will fit this data, and how close is it? Through discussion and partner work, young mathematicians learn the procedure to determine a regression line in order to make predictions from the data.
Virginia Department of Education
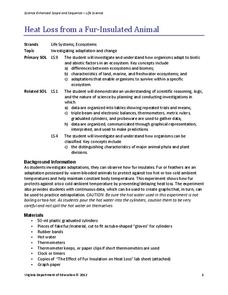
Heat Loss from a Fur-Insulated Animal
How do animals adapt to weather changes? Provide your class with the ability to understand adaptations and body temperature as they participate in this hands on experiment, using fake fur and hot water. Pupils collect data and analyze...
Towson University
It's a Gassy World!
How much does your class know about the relationship between climate change and carbon dioxide? Science scholars explore the nature of greenhouse gases and rising ocean temperature through demonstrations, research, and experiments. The...
American Statistical Association
Spinners at the School Carnival (Equal Sections)
Spin to win a toy car. A fun activity has pupils use a spinner in which three of the equal sections represent winning a toy car, and the fourth section represents no car. They record the number of wins after certain numbers of spins,...
NASA
Development of a Model: Analyzing Elemental Abundance
How do scientists identify which elements originate from meteorites? Scholars learn about a sample of material found in a remote location, analyzing the sample to determine if it might be from Earth or not. They study elements, isotopes,...
Curated OER
Froot Loops to the Max - 3
Learners complete and solve five questions/problems related to a box of Froot Loops cereal. First, they determine how many of each color of Froot Loops are in the box. Then, pupils determine which color had the greatest frequency and...
Curated OER
Virtual Field Trip
This hands-on resource has future trip planners analyze graphs of mileage, gasoline costs, and travel time on different routes. While this was originally designed for a problem-solving exercise using a Michigan map, it could be used as a...
Curated OER
Is the Rainbow Fair?
Third graders perform statistical calculations. Given a bag of Skittles, 3rd graders sort and collect data regarding the colors included in their bag. Using spreadsheet software, students create a bar graph of the information collected....
Curated OER
Finding Equations
Students make equations from everyday data. They create a graph from the equations. Students predict and analyze the results. Students complete the second scenario on their own and turn in their handout.
Curated OER
Latitude
Young scholars examine the theory of finding latitude and discuss the uses of an astrolabe, cross-staff and octant. They determine an Astronomical Table for their classroom.
Curated OER
Energy Conservation Lesson 1: Fossil Fuels and the Ticking Clock
Students explore energy production by participating in a class discussion. In this renewable energy lesson, students discuss the differences between solar, coal, wind and fossil fuel energy sources and why some are better for the...
Curated OER
Science and Technology
Students research inventions that have been created. In this historical technology lesson, students read the Harcourt Brace social studies textbook and discuss how inventors used graphs to display data. Students create a table to write...
University of Georgia
Energy Content of Foods
Why do athletes load up on carbohydrates the evening before a competition? The lesson helps answer this question as it relates the type of food to the amount of energy it contains. After a discussion, scholars perform an experiment to...
Curated OER
Graphing With RXTE
High schoolers use data from the Rossi X-ray Tiiming Explorer (RXTE) satellite to analyze and graph.
Curated OER
McCadam's Quarterly Report
Fourth graders problem solve a problem from a local business using data, generating graphs, and draw conclusions. They submit their findings in a business letter format with feed back from a company's plant manager.
Curated OER
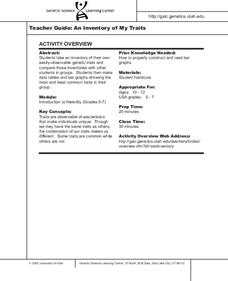
An Inventory of My Traits
Students take an inventory of their own easily-observable genetic traits and
compare those inventories with other students in groups. They then make
data tables and bar graphs showing the most and least common traits in their group.
Curated OER
Conducting a Scientific Investigation
Students investigate a possible health problem in the local school district through inquiry into attendance records, activities, maps, graphs, and data tables. The simulation continues as solutions for the problem are sought.
Curated OER
Multiple Representations
Every topic or subject has its own special jargon. Learners work on their math vocabulary as it relates to basic algebra terms. They define and identify function, functional notation, ordered pairs, rate of change, slope,...
Curated OER
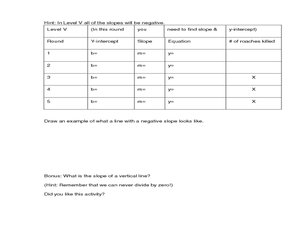
Cockroach Slope
Students identify the slope of linear functions. In this slope lesson, students collect data and graph it. They write equations with no more than two variables and use technology to explain their data.
Curated OER
Show Me!
Students analyze and interpret graphs. In this graphing lesson, students view a video and construct their own graphs (line, circle, bar) from given sets of data.
Curated OER
Graphs Galore
Fourth graders conduct surveys to collect data. They analyze and interpret the data, then determine which type of graph is appropriate for the data. Students use the data to make predictions, discover patterns and draw conclusions...
Curated OER
Canada's Climate: Temperature and Rainfall Variations
Students analyze data about various climates in Canada. In this data analysis and climate lesson, students use Canada Year Book 1999 to complete a worksheet and make connections between precipitation and temperature in different climates.
Curated OER
M & Ms in a Bag
Students make predictions about the number and colors of M&M's in a snack size package. They create an Excel spreadsheet to record the data from their small group's bag, create a graph of the data, and discuss the variations of data...


